Money
The Big Mac Index: A Measure of Purchasing Power Parity & Burger Inflation
Article/Editing:
The Big Mac Index: A Measure of PPP and Burger Inflation
The Big Mac was created in 1967 by Jim Delligati, a McDonald’s franchise owner in Pennsylvania. It was launched throughout the U.S. the following year, and today you can buy one in more than 70 countries. However, the price you pay will vary based on where you are, as evidenced by the Big Mac Index.
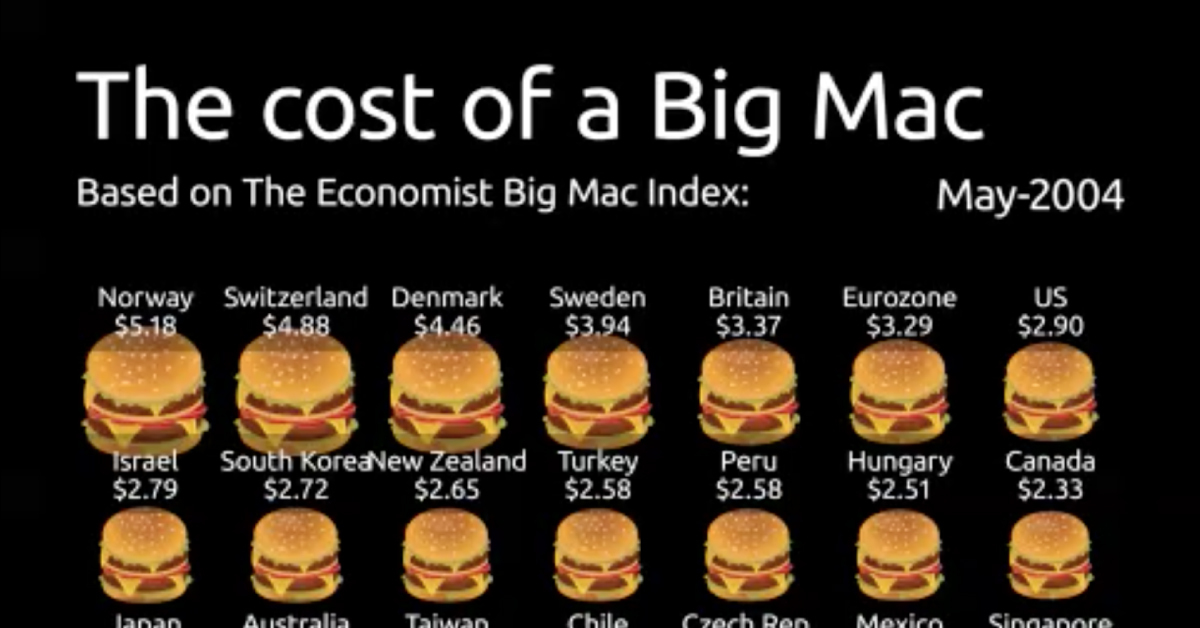
Spanning from 2004-2022, this animation from James Eagle shows the U.S. dollar price of a Big Mac in select countries around the world.
What Does the Big Mac Index Show?
The Big Mac Index was invented by The Economist in 1986. It is intended to be a lighthearted way to demonstrate the concept of purchasing power parity. In other words, it helps illustrate the idea that market exchange rates between countries may be “out of whack” when compared to the cost of buying the same basket of goods and services in those places.
Given that McDonald’s is one of the biggest companies in the world and the Big Mac is widely available globally, it means that the famous burger can be used as a basic goods comparison between most countries. It also has the advantage of having the same inputs and distribution system, with a few minor modifications (like chicken patties in India instead of beef).
Using the price of a Big Mac in two countries, the index can give an indication as to whether a currency may be over or undervalued. For example, a Big Mac costs ¥24.40 in China and $5.81 in the United States. By comparing the implied exchange rate to the actual exchange rate, we can see whether the Yuan is over or undervalued.
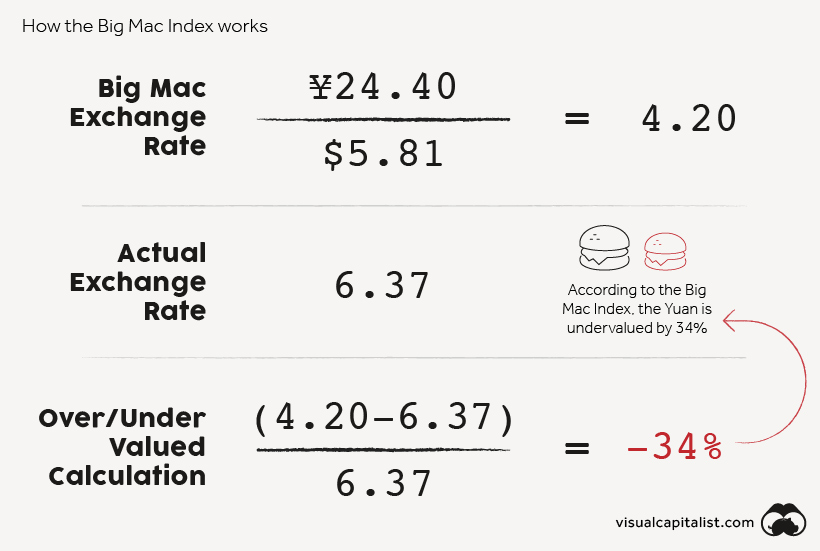
According to the Big Mac Index, the Yuan is undervalued by 34%.
Beyond currency misalignment, the index has other uses. For instance, it shows inflation in burger prices over time. If we compare the price of a Big Mac across countries in the same currency—such as the U.S. dollar—we are also able to see where burgers are cheaper or relatively more expensive.
Burger Costs Around the World
In the animation, all Big Mac prices have been converted from local currency to U.S. dollars based on the actual exchange rate in effect at the time. Below, we show the change in price of a Big Mac in select countries, ordered by January 2022 prices.
| Country | May 2004 | January 2022 | % change |
|---|---|---|---|
| Switzerland | $4.88 | $6.98 | 43% |
| Norway | $5.18 | $6.39 | 23% |
| United States | $2.90 | $5.81 | 100% |
| Sweden | $3.94 | $5.79 | 47% |
| Israel | $2.79 | $5.35 | 92% |
| Canada | $2.33 | $5.32 | 129% |
| Venezuela | $1.48 | $5.06 | 243% |
| Euro area | $3.29 | $4.95 | 51% |
| Denmark | $4.46 | $4.82 | 8% |
| Britain | $3.37 | $4.82 | 43% |
| New Zealand | $2.65 | $4.60 | 73% |
| Australia | $2.27 | $4.51 | 98% |
| Singapore | $1.93 | $4.36 | 126% |
| Brazil | $1.70 | $4.31 | 154% |
| Argentina | $1.48 | $4.29 | 190% |
| Sri Lanka | $1.41 | $4.15 | 193% |
| Czech Republic | $2.13 | $4.11 | 93% |
| Chile | $2.18 | $3.88 | 78% |
| Thailand | $1.45 | $3.84 | 166% |
| China | $1.26 | $3.83 | 205% |
| South Korea | $2.72 | $3.82 | 40% |
| Poland | $1.63 | $3.44 | 111% |
| Japan | $2.32 | $3.38 | 46% |
| Peru | $2.58 | $3.36 | 31% |
| Mexico | $2.07 | $3.34 | 62% |
| Hungary | $2.51 | $3.09 | 23% |
| Hong Kong | $1.54 | $2.82 | 83% |
| Philippines | $1.23 | $2.79 | 126% |
| Taiwan | $2.25 | $2.70 | 20% |
| South Africa | $1.86 | $2.58 | 39% |
| Ukraine | $1.36 | $2.43 | 79% |
| Malaysia | $1.33 | $2.39 | 80% |
| Indonesia | $1.77 | $2.36 | 34% |
| Turkey | $2.58 | $1.86 | -28% |
| Russia | $1.45 | $1.74 | 20% |
Switzerland takes the cake for the priciest Big Mac, followed closely behind by Norway. Both countries have relatively high price levels but also enjoy higher wages when compared to other OECD countries.
Venezuela has seen the largest jump in burger prices, with the cost of a Big Mac climbing nearly 250% since 2004. The country has been plagued by hyperinflation for years, so it’s no surprise to see large price swings in the country’s data.
While it appears that the price of a Big Mac has decreased in Turkey, this is because the prices are shown in U.S. dollars. The new Turkish lira has depreciated against the U.S. dollar more than 90% since it was introduced in 2005.
Finally, it’s worth noting that Russia has the cheapest Big Mac, reflecting the country’s lower price levels. Labor costs in Russia are roughly a third of those in Switzerland.
The Limitations of Burgernomics
The Big Mac Index is useful for a number of reasons. Investors can use it to measure inflation over time, and compare this to official records. This can help them value bonds and other securities that are sensitive to inflation. The Big Mac Index also indicates whether a currency may be over or undervalued, and investors can place foreign exchange trades accordingly.
Of course, the index does have shortcomings. Here are some that economists have noted.
- Non-traded services can have different prices across countries. The price of a Big Mac will be influenced by the costs of things like labor, but this is not a reflection of relative currency values. The Economist now releases a GDP-adjusted version of the Big Mac Index to help address this criticism.
- McDonald’s is not in every country in the world. This means the geographic reach of the Big Mac Index has some limitations, particularly in Africa.
- The index lacks diversity. The index is made up of one item: the Big Mac. Because of this, it lacks the diversity of other economic metrics such as the Consumer Price Index.
Despite all of these limitations, the Big Mac Index does act as a good starting place for understanding purchasing power parity. Through the simplicity of burgers, complex economic theory is easier to digest.

This article was published as a part of Visual Capitalist's Creator Program, which features data-driven visuals from some of our favorite Creators around the world.


Economy
Ranked: The Top 20 Countries in Debt to China
The 20 nations featured in this graphic each owe billions in debt to China, posing concerns for their economic future.
Ranked: The Top 20 Countries in Debt to China
This was originally posted on our Voronoi app. Download the app for free on iOS or Android and discover incredible data-driven charts from a variety of trusted sources.
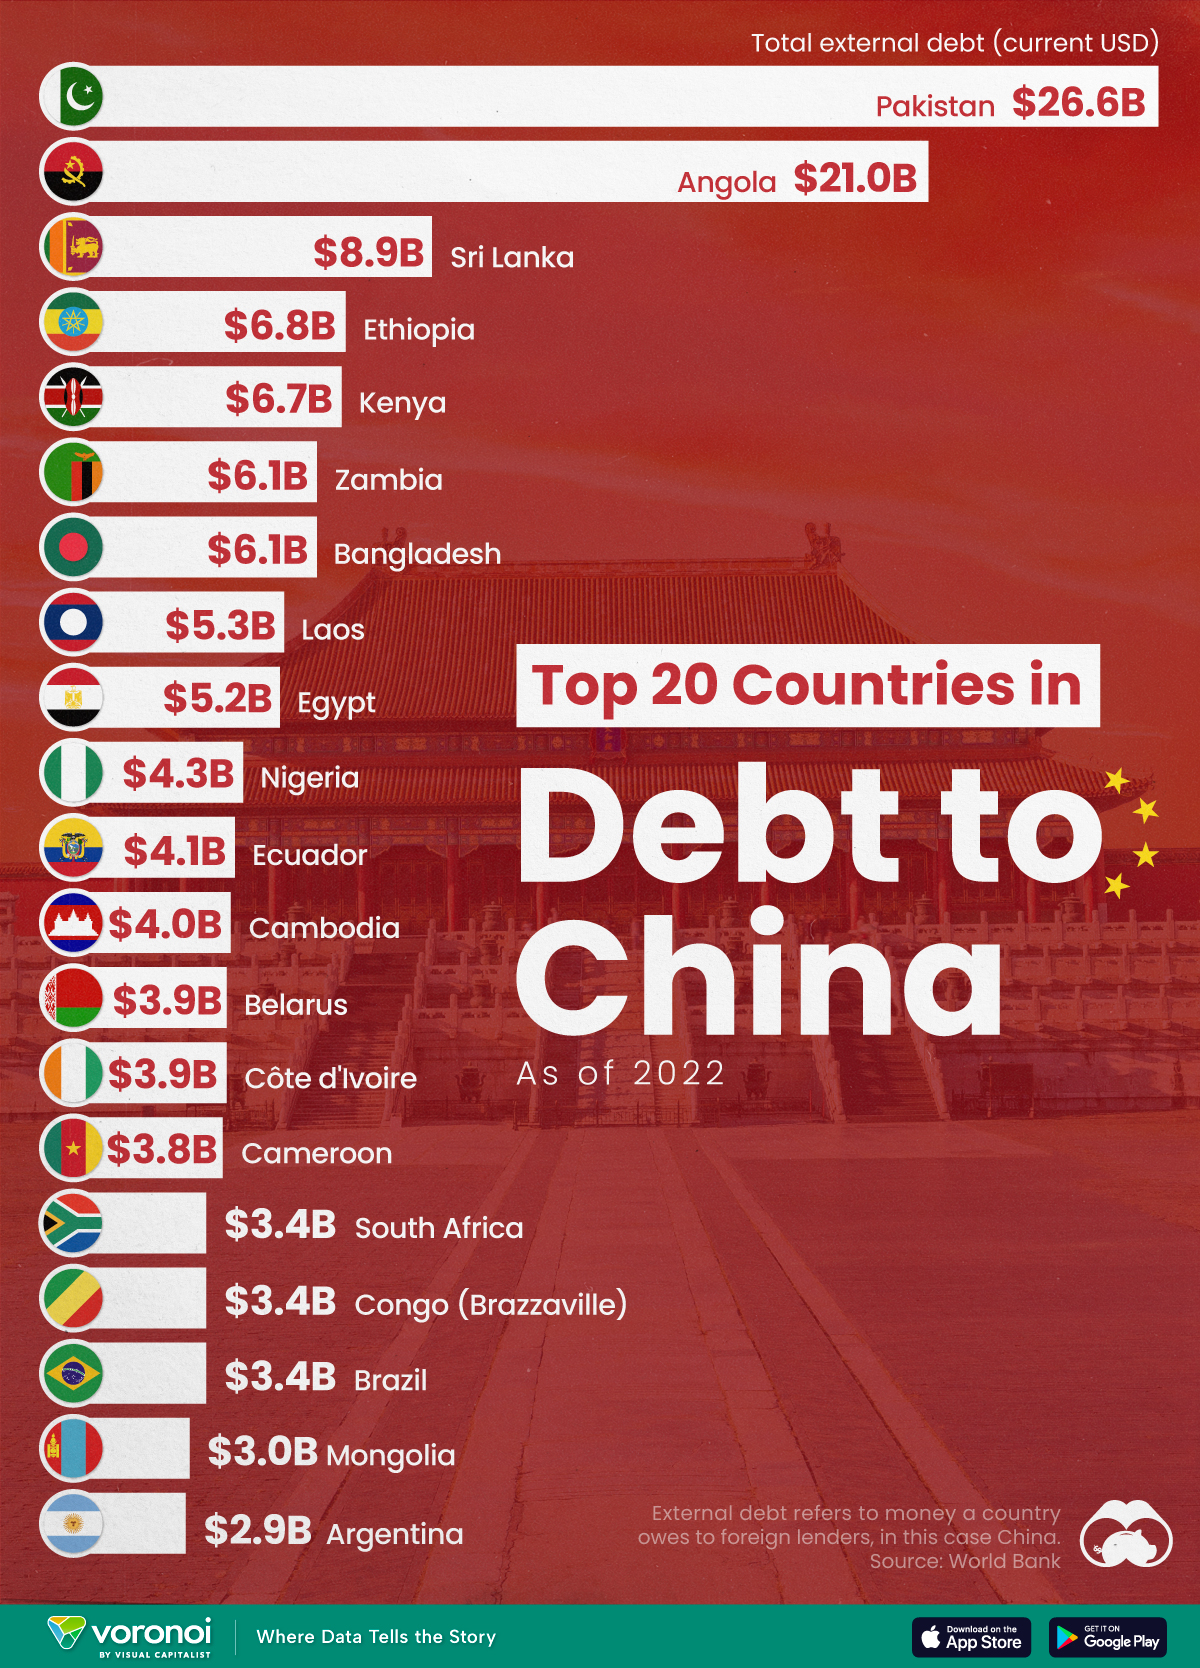
In this graphic, we ranked the top 20 countries by their amount of debt to China. These figures are as of 2022, and come from the World Bank (accessed via Yahoo Finance).
The data used to make this graphic can be found in the table below.
| Country | Total external debt to China ($B) |
|---|---|
| 🇵🇰 Pakistan | $26.6 |
| 🇦🇴 Angola | $21.0 |
| 🇱🇰 Sri Lanka | $8.9 |
| 🇪🇹 Ethiopia | $6.8 |
| 🇰🇪 Kenya | $6.7 |
| 🇧🇩 Bangladesh | $6.1 |
| 🇿🇲 Zambia | $6.1 |
| 🇱🇦 Laos | $5.3 |
| 🇪🇬 Egypt | $5.2 |
| 🇳🇬 Nigeria | $4.3 |
| 🇪🇨 Ecuador | $4.1 |
| 🇰🇭 Cambodia | $4.0 |
| 🇨🇮 Côte d'Ivoire | $3.9 |
| 🇧🇾 Belarus | $3.9 |
| 🇨🇲 Cameroon | $3.8 |
| 🇧🇷 Brazil | $3.4 |
| 🇨🇬 Republic of the Congo | $3.4 |
| 🇿🇦 South Africa | $3.4 |
| 🇲🇳 Mongolia | $3.0 |
| 🇦🇷 Argentina | $2.9 |
This dataset highlights Pakistan and Angola as having the largest debts to China by a wide margin. Both countries have taken billions in loans from China for various infrastructure and energy projects.
Critically, both countries have also struggled to manage their debt burdens. In February 2024, China extended the maturity of a $2 billion loan to Pakistan.
Soon after in March 2024, Angola negotiated a lower monthly debt payment with its biggest Chinese creditor, China Development Bank (CDB).
Could China be in Trouble?
China has provided developing countries with over $1 trillion in committed funding through its Belt and Road Initiative (BRI), a massive economic development project aimed at enhancing trade between China and countries across Asia, Africa, and Europe.
Many believe that this lending spree could be an issue in the near future.
According to a 2023 report by AidData, 80% of these loans involve countries in financial distress, raising concerns about whether participating nations will ever be able to repay their debts.
While China claims the BRI is a driver of global development, critics in the West have long warned that the BRI employs debt-trap diplomacy, a tactic where one country uses loans to gain influence over another.
Learn More About Debt from Visual Capitalist
If you enjoyed this post, check out our breakdown of $97 trillion in global government debt.

-

 Demographics7 days ago
The Countries That Have Become Sadder Since 2010
-

 Green2 weeks ago
Ranked: The Countries With the Most Air Pollution in 2023
-

 Green2 weeks ago
Ranking the Top 15 Countries by Carbon Tax Revenue
-

 Markets2 weeks ago
U.S. Debt Interest Payments Reach $1 Trillion
-

 Mining2 weeks ago
Gold vs. S&P 500: Which Has Grown More Over Five Years?
-

 Energy2 weeks ago
The World’s Biggest Nuclear Energy Producers
-

 Misc2 weeks ago
How Hard Is It to Get Into an Ivy League School?
-

 Debt2 weeks ago
How Debt-to-GDP Ratios Have Changed Since 2000