I want to provide an example for how to plot 3D map plots with the deckgl package in R. I generate a bar plot on a map layout from Mapbox.
First, I define our Open Street Map geocoding function, found on datascienceplus.com. It geocodes address strings into longitude and latitude coordinates using the Open Street Map API (OSM-API).
## documentation: http://wiki.openstreetmap.org/wiki/Nominatim
# source: https://datascienceplus.com/osm-nominatim-with-r-getting-locations-geo-coordinates-by-its-address/
osm_geocoder <- function(address = NULL)
{
  if(suppressWarnings(is.null(address)))
    return(data.frame())

  tryCatch(
    d <- jsonlite::fromJSON(
      gsub('\\@addr\\@', gsub('\\s+', '\\%20', address),
           'http://nominatim.openstreetmap.org/search/@addr@?format=json&addressdetails=0&limit=1')
    ), error = function(c) return(data.frame())
  )

  if(length(d) == 0)
    return(data.frame())

  return(data.frame(lon = as.numeric(d$lon), lat = as.numeric(d$lat)))
}
After that, I build a list with city names. I feed this list to the geocoding function, thereby generating a geocoded data frame.
city_list <- c("Frankfurt, Germany",
"Dortmund, Germany",
"Berlin, Germany",
"Stuttgart, Germany",
"Karlsruhe, Germany",
"Zurich, Switzerland",
"Wien, Austria",
"Bern, Switzerland",
"Munich, Germany",
"Marburg, Germany",
"Giessen, Germany",
"Pforzheim, Germany",
"Cologne, Germany",
"Essen, Germany",
"Heidelberg, Germany",
"Kassel, Germany",
"Paderborn, Germany",
"Leipzig, Germany",
"Dresden, Germany",
"Nuremberg, Germany",
"Augsburg, Germany",
"Regensburg, Germany",
"Pilsen, Czech Republic",
"Linz, Austria",
"Innsbruck, Austria",
"Bamberg, Germany",
"Fulda, Germany",
"Hanover, Germany",
"Wolfsburg, Germany",
"Magdeburg, Germany",
"Jena, Germany",
"Chemnitz, Germany",
"Zwickau, Germany",
"Cottbus, Germany",
"Bautzen, Germany",
"Mainz, Germany",
"Bonn, Germany",
"Duesseldorf, Germany",
"Trier, Germany",
"Mannheim, Germany",
"Aachen, Germany",
"Freiburg, Germany",
"Ulm, Germany",
"Kempten, Germany",
"Ingolstadt, Germany")
# lets generate a data frame that we can use for the add_grid_layer function
data_df_columns <- data.frame(matrix(nrow=3500*length(city_list),ncol=4))
colnames(data_df_columns) <- c("ADDRESS","RACKS","SPACES","COORDINATES")
data_df_columns$RACKS <- 2
data_df_columns$SPACES <- 4
for(i in 1:length(city_list)){
print(i)
dum_coord <- osm_geocoder(city_list[i])
for(j in 1:3500){
data_df_columns$ADDRESS <- paste0(city_list[i]," : ",j)
dum_long <- rnorm(1, mean=as.numeric(dum_coord[1]),sd=0.75)
dum_lat <- rnorm(1,mean=as.numeric(dum_coord[2]),sd=0.75)
data_df_columns$COORDINATES[(i-1)*3500+j] <- list(c(dum_long, dum_lat))
}
}
properties_grid <- list(
pickable = TRUE,
extruded = TRUE,
cellSize = 1600,
elevationScale = 8,
coverage = 0.5,
colorRange = list(c(0,255,255),
c(0,204,255),
c(0,153,255),
c(0,51,255),
c(0,0,255),
c(0,0,204)),
getPosition = JS("data => data.COORDINATES"),
getTooltip = JS("object => object.count")
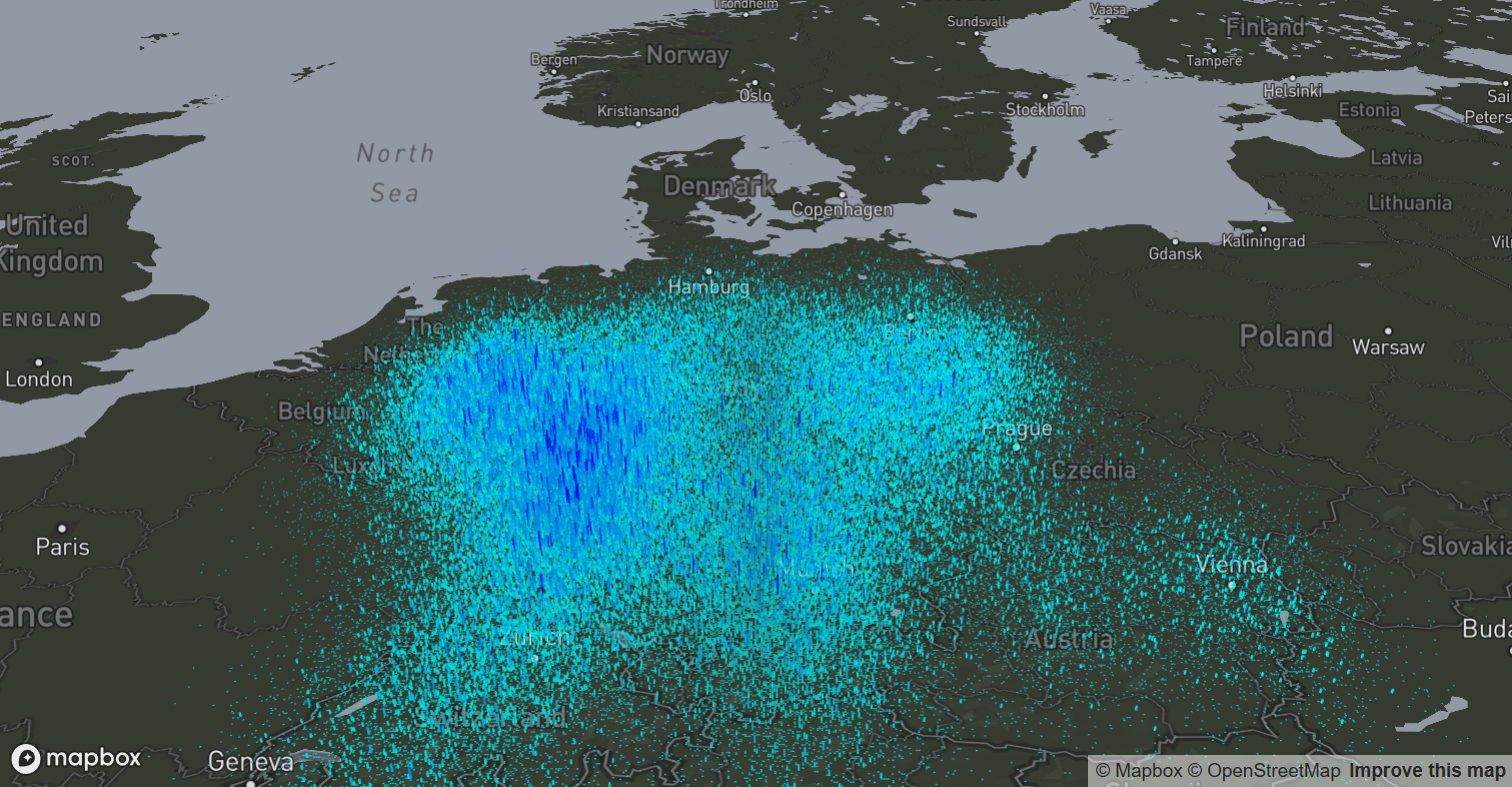
)Once I have a dataset with my artifically created spatial data points, geocoded with the geocoding function, I can plot them using the deckgl package in R. The basemaps are created in Mapbox.
deckgl(zoom = 10, pitch = 120, longitude = 8.682092, latitude = 50.11064) %>%
  add_grid_layer(data = data_df_columns,properties = properties_grid) %>%
  add_mapbox_basemap(style = "mapbox://styles/linnartsf/cjq6p9q8f8zwf2rp74qf2o3d5")
I have published some other posts of spatial data visualisation in R that you might want to check out.

Data scientist focusing on simulation, optimization and modeling in R, SQL, VBA and Python


2 comments
Hi Linnart,
Great blog you have, I would like to ask how did you add the mapbox_basemap?
I try with your code above in R and create a base map on mapbox, but R only showed the layer I add on but not the base map.
Hi Andrew.
Thank you for your nice feedback and good question. You need to proceed as follows:
1) Go to MapBox website and set up a user account
2) Create a map layout on the MapBox website
3) For the map you created you will get a token
4) in R, use the following line of code placing your token key instead of yourTokenString:
Sys.setenv(MAPBOX_API_TOKEN = yourTokenString)