Money
Mapping Out the Richest Billionaires in Each Country
Article/Editing:

Click to view a larger version of the graphic.
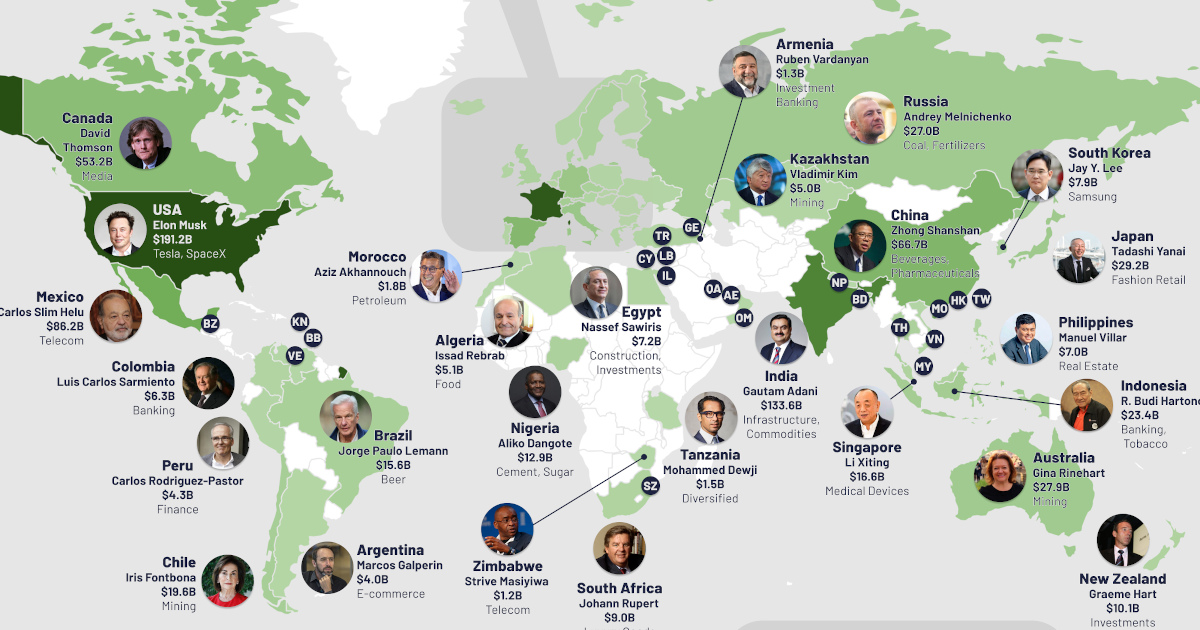
Mapping Out The Richest Billionaires in Each Country
While there are nearly 8 billion people in the world, just over 3,000 are billionaires as of November 2022. This tiny group of people is worth nearly $11.8 trillion—Equivalent to about 11.8% of global GDP.
Where do these billionaires live? This graphic by Truman Du uses data from Forbes to map out the richest billionaires around the world.
The Full List
As it turns out, billionaires are a lot more geographically concentrated than you might think.
In fact, of the 195 officially recognized countries around the world, only 76 are home to billionaires. And even within these countries, there’s vast disparities between the quantity of billionaires.
Here’s a breakdown of all the countries that have at least one billionaire. For countries with more than one, we’ve highlighted the billionaire with the highest net worth as of November 28, 2022:
| Country/territory | Name | Net worth ($B) | Main source of wealth (sector) |
|---|---|---|---|
| 🇩🇿 Algeria | Issad Rebrab | 5.1 | food |
| 🇦🇷 Argentina | Marcos Galperin | 4.0 | e-commerce |
| 🇦🇲 Armenia | Ruben Vardanyan | 1.3 | investment banking |
| 🇦🇺 Australia | Gina Rinehart | 27.9 | mining |
| 🇦🇹 Austria | Georg Stumpf | 7.9 | real estate, construction |
| 🇧🇩 Bangladesh | Muhammed Aziz Khan | 1.0 | power |
| 🇧🇧 Barbados | Rihanna | 1.4 | music, cosmetics |
| 🇧🇪 Belgium | Eric Wittouck | 9.0 | investments |
| 🇧🇿 Belize | Kenneth Dart | 4.0 | investments |
| 🇧🇷 Brazil | Jorge Paulo Lemann | 15.6 | beer |
| 🇧🇬 Bulgaria | Georgi & Kiril Domuschiev | 1.9 | animal health, investments |
| 🇨🇦 Canada | David Thomson | 53.2 | media |
| 🇨🇱 Chile | Iris Fontbona | 19.6 | mining |
| 🇨🇳 China | Zhong Shanshan | 66.7 | beverages, pharmaceuticals |
| 🇨🇴 Colombia | Luis Carlos Sarmiento | 6.3 | banking |
| 🇨🇾 Cyprus | John Fredriksen | 11.4 | shipping |
| 🇨🇿 Czechia | Renata Kellnerova | 16.0 | finance, telecommunications |
| 🇩🇰 Denmark | Anders Holch Povlsen | 11.9 | fashion retail |
| 🇪🇬 Egypt | Nassef Sawiris | 7.2 | construction, investments |
| 🇪🇪 Estonia | Kristo Kaarmann | 1.4 | payments, banking |
| 🇫🇮 Finland | Antti Herlin | 3.9 | elevators, escalators |
| 🇫🇷 France | Bernard Arnault | 179.5 | LVMH |
| 🇬🇪 Georgia | Bidzina Ivanishvili | 4.8 | investments |
| 🇩🇪 Germany | Beate Heister & Karl Albrecht Jr. | 35.1 | supermarkets |
| 🇬🇷 Greece | Vicky Safra | 7.1 | banking |
| 🇬🇬 Guernsey | Stephen Lansdown | 2.3 | financial services |
| 🇭🇰 Hong Kong | Li Ka-shing | 33.0 | diversified |
| 🇭🇺 Hungary | Sandor Csanyi | 1.1 | finance, real estate |
| 🇮🇸 Iceland | Thor Bjorgolfsson | 2.5 | investments |
| 🇮🇳 India | Gautam Adani | 133.6 | infrastructure, commodities |
| 🇮🇩 Indonesia | R. Budi Hartono | 23.4 | banking, tobacco |
| 🇮🇪 Ireland | John Collison & Patrick Collison | 8,1 | payments software |
| 🇮🇱 Israel | Eyal Ofer | 14.4 | real estate, shipping |
| 🇮🇹 Italy | Giovanni Ferrero | 34.4 | Nutella, chocolates |
| 🇯🇵 Japan | Tadashi Yanai | 29.2 | fashion retail |
| 🇰🇿 Kazakhstan | Vladimir Kim | 5.0 | mining |
| 🇱🇧 Lebanon | Taha Mikati | 2.8 | telecom |
| 🇱🇮 Liechtenstein | Christoph Zeller | 2.2 | dental materials |
| 🇲🇴 Macau | Hoi Kin Hong | 1.2 | real estate |
| 🇲🇾 Malaysia | Quek Leng Chan | 10.2 | banking, property |
| 🇲🇽 Mexico | Carlos Slim Helu | 86.2 | telecom |
| 🇲🇨 Monaco | Stefano Pessina | 9.3 | drugstores |
| 🇲🇦 Morocco | Aziz Akhannouch | 1.8 | petroleum |
| 🇳🇵 Nepal | Binod Chaudhary | 1.5 | diversified |
| 🇳🇱 Netherlands | Charlene de Carvalho-Heineken | 15.0 | Heineken |
| 🇳🇿 New Zealand | Graeme Hart | 10.1 | investments |
| 🇳🇬 Nigeria | Aliko Dangote | 12.9 | cement, sugar |
| 🇳🇴 Norway | Andreas Halvorsen | 6.6 | hedge funds |
| 🇴🇲 Oman | Suhail Bahwan | 2.0 | diversified |
| 🇵🇪 Peru | Carlos Rodriguez-Pastor | 4.3 | finance |
| 🇵🇭 Philippines | Manuel Villar | 7.0 | real estate |
| 🇵🇱 Poland | Michal Solowow | 6.0 | investments |
| 🇵🇹 Portugal | Maria Fernanda Amorim | 4.5 | energy, investments |
| 🇶🇦 Qatar | Faisal Bin Qassim Al Thani | 1.9 | hotels |
| 🇷🇴 Romania | Ion Stoica & Matei Zaharia | 1.6 | data analytics |
| 🇷🇺 Russia | Andrey Melnichenko | 27.0 | coal, fertilizers |
| 🇸🇬 Singapore | Li Xiting | 16.6 | medical devices |
| 🇸🇰 Slovakia | Ivan Chrenko | 1.6 | real estate |
| 🇿🇦 South Africa | Johann Rupert | 9.0 | luxury goods |
| 🇰🇷 South Korea | Jay Y. Lee | 7.9 | samsung |
| 🇪🇸 Spain | Amancio Ortega | 62.5 | Zara |
| 🇰🇳 St. Kitts and Nevis | Myron Wentz | 1.3 | health products |
| 🇸🇿 Swaziland (Eswatini) | Nathan Kirsh | 5.4 | retail, real estate |
| 🇸🇪 Sweden | Stefan Persson | 15.3 | H&M |
| 🇨🇭Switzerland | Guillaume Pousaz | 23.0 | fintech |
| 🇹🇼 Taiwan | Zhang Congyuan | 6.7 | shoes |
| 🇹🇿 Tanzania | Mohammed Dewji | 1.5 | diversified |
| 🇹🇭 Thailand | Sarath Ratanavadi | 12.2 | energy |
| 🇹🇷 Turkey | Ibrahim Erdemoglu | 6.5 | carpet |
| 🇺🇦 Ukraine | Rinat Akhmetov | 4.3 | steel, coal |
| 🇦🇪 United Arab Emirates | Pavel Durov | 15.1 | messaging app |
| 🇬🇧 United Kingdom | Michael Platt | 15.2 | hedge funds |
| 🇺🇸 United States | Elon Musk | 191.2 | Tesla, SpaceX |
| 🇻🇪 Venezuela | Juan Carlos Escotet | 3.2 | banking |
| 🇻🇳 Vietnam | Pham Nhat Vuong | 4.7 | diversified |
| 🇿🇼 Zimbabwe | Strive Masiyiwa | 1.2 | telecom |
The United States is well known to have one of the highest concentrations of billionaires. It’s home to over 900, with Elon Musk the wealthiest of them all with a staggering net worth of over $191 billion in November 2022. That makes him not just the richest billionaire in America, but the richest person in the world.
China has the second highest concentration of billionaires, with 400 ultra-wealthy that have a combined net worth of $1.45 trillion. China’s richest billionaire, Zhong Shanshan, is the founder of the Nongfu Spring beverage company.
Interestingly, there are no clear patterns when it comes to the type of industry or sector that these billionaires are involved in. The exception is the U.S., where a significant number of billionaires are linked to the tech industry.
And it’s important to note that some heads of states are reportedly billionaires, and in many cases might be the wealthiest people in their respective countries. But their wealth is often a state secret, well-diversified, and too difficult to accurately estimate.
Male vs. Female Billionaires
One trend that does stand out is the number of men versus women who are billionaires. Of the 76 billionaires on the list, only 7 are women.
This pattern is also evident when looking at the entire billionaire population—of the 3,311 billionaires worldwide, only 12.9% are women.
It’s worth mentioning that this population of billionaire women is rising. According to Forbes, the 2021 list included 328 women, 36% more than in 2020.

This article was published as a part of Visual Capitalist's Creator Program, which features data-driven visuals from some of our favorite Creators around the world.


Money
How Debt-to-GDP Ratios Have Changed Since 2000
See how much the debt-to-GDP ratios of advanced economies have grown (or shrank) since the year 2000.


How Debt-to-GDP Ratios Have Changed Since 2000
This was originally posted on our Voronoi app. Download the app for free on Apple or Android and discover incredible data-driven charts from a variety of trusted sources.
Government debt levels have grown in most parts of the world since the 2008 financial crisis, and even more so after the COVID-19 pandemic.
To gain perspective on this long-term trend, we’ve visualized the debt-to-GDP ratios of advanced economies, as of 2000 and 2024 (estimated). All figures were sourced from the IMF’s World Economic Outlook.
Data and Highlights
The data we used to create this graphic is listed in the table below. “Government gross debt” consists of all liabilities that require payment(s) of interest and/or principal in the future.
| Country | 2000 (%) | 2024 (%) | Change (pp) |
|---|---|---|---|
| 🇯🇵 Japan | 135.6 | 251.9 | +116.3 |
| 🇸🇬 Singapore | 82.3 | 168.3 | +86.0 |
| 🇺🇸 United States | 55.6 | 126.9 | +71.3 |
| 🇬🇧 United Kingdom | 36.6 | 105.9 | +69.3 |
| 🇬🇷 Greece | 104.9 | 160.2 | +55.3 |
| 🇫🇷 France | 58.9 | 110.5 | +51.6 |
| 🇵🇹 Portugal | 54.2 | 104.0 | +49.8 |
| 🇪🇸 Spain | 57.8 | 104.7 | +46.9 |
| 🇸🇮 Slovenia | 25.9 | 66.5 | +40.6 |
| 🇫🇮 Finland | 42.4 | 76.5 | +34.1 |
| 🇭🇷 Croatia | 35.4 | 61.8 | +26.4 |
| 🇨🇦 Canada | 80.4 | 103.3 | +22.9 |
| 🇨🇾 Cyprus | 56.0 | 70.9 | +14.9 |
| 🇦🇹 Austria | 65.7 | 74.0 | +8.3 |
| 🇸🇰 Slovak Republic | 50.5 | 56.5 | +6.0 |
| 🇩🇪 Germany | 59.3 | 64.0 | +4.7 |
| 🇧🇪 Belgium | 109.6 | 106.8 | -2.8 |
| 🇮🇱 Israel | 77.4 | 56.8 | -20.6 |
| 🇮🇸 Iceland | 75.8 | 54.6 | -21.2 |
The debt-to-GDP ratio indicates how much a country owes compared to the size of its economy, reflecting its ability to manage and repay debts. Percentage point (pp) changes shown above indicate the increase or decrease of these ratios.
Countries with the Biggest Increases
Japan (+116 pp), Singapore (+86 pp), and the U.S. (+71 pp) have grown their debt as a percentage of GDP the most since the year 2000.
All three of these countries have stable, well-developed economies, so it’s unlikely that any of them will default on their growing debts. With that said, higher government debt leads to increased interest payments, which in turn can diminish available funds for future government budgets.
This is a rising issue in the U.S., where annual interest payments on the national debt have surpassed $1 trillion for the first time ever.
Only 3 Countries Saw Declines
Among this list of advanced economies, Belgium (-2.8 pp), Iceland (-21.2 pp), and Israel (-20.6 pp) were the only countries that decreased their debt-to-GDP ratio since the year 2000.
According to Fitch Ratings, Iceland’s debt ratio has decreased due to strong GDP growth and the use of its cash deposits to pay down upcoming maturities.
See More Debt Graphics from Visual Capitalist
Curious to see which countries have the most government debt in dollars? Check out this graphic that breaks down $97 trillion in debt as of 2023.

-

 Money2 weeks ago
Which States Have the Highest Minimum Wage in America?
-

 Misc1 week ago
Airline Incidents: How Do Boeing and Airbus Compare?
-

 Environment1 week ago
Top Countries By Forest Growth Since 2001
-

 United States2 weeks ago
Where U.S. Inflation Hit the Hardest in March 2024
-

 Demographics2 weeks ago
The Smallest Gender Wage Gaps in OECD Countries
-

 Markets2 weeks ago
The Top 10 States by Real GDP Growth in 2023
-

 Countries2 weeks ago
Population Projections: The World’s 6 Largest Countries in 2075
-

 Travel2 weeks ago
Ranked: The World’s Top Flight Routes, by Revenue