
ABSTRACT
The evolutionary changes in pulsation period for the Cepheid Polaris are reinvestigated using archival observational material (radial velocities, photometry, and eye observations) over the interval 1844 to the present, including new photometry for the star obtained in 2003–2004. The star's pulsation period increased at a rate of 4.5 s yr−1 during that interval, with the exception of a brief hiatus between 1963 and 1966, when it suddenly decreased, possibly as a result of a brief reduction in average stellar radius amounting to −0.055%. At roughly the same time, the pulsation amplitude of Polaris underwent a marked change. Prior to 1963 the V amplitude was in excess of about 0.1 mag, possibly decreasing at a rate of 0.019 mag century−1. Following the hiatus of 1963–1966, the pulsation amplitude underwent a sharp decline and now appears to be erratic on a cycle‐to‐cycle basis, always smaller than 0.05 mag. The rapid rate of period increase for Polaris is consistent with a first crossing of the Cepheid instability strip, while the hiatus of 1963–1966 and sudden decrease in pulsation amplitude thereafter suggest that the star may have left the instability strip for first crossers at that time, leaving it near the center of the instability strip for Cepheids in higher crossing modes.
Export citation and abstract BibTeX RIS
1. INTRODUCTION
The North Star, Polaris (α UMi), is the brightest and closest of 40 classical Cepheids detectable without visual aid. As such, it provides a valuable reference standard for other members of the class. The variable presents many challenges to observers because of its brightness (〈V〉≃2.0), its proximity to the north celestial pole, and the lack of suitable reference stars of comparable brightness in its immediate vicinity. Despite such difficulties, Polaris has been an enticing target for many different observers for more than a century and a half, and its observed properties have become a matter of continued debate.
The discovery of brightness variations in Polaris is attributed to Seidel (1852) on the basis of his comparison of available magnitude estimates for the star, but additional evidence was also presented by Schmidt (1857), who summarized results of his visual comparison of Polaris with β UMi, which at V = 2.07 (Iriarte et al. 1965) was noted by Schmidt to be the slightly fainter of the two stars. Schmidt's observations were not considered definitive, however, since it seemed that the period of variability, for which Schmidt found a value of about 365 days, might arise from atmospheric extinction differences between the two stars during the course of the year, in combination with optical effects arising from the comparison of two stars of nearly identical brightness viewed at different projection angles over the same time interval.
The actual 4 day period of variability for Polaris was deduced by Campbell (1899) from radial velocity measures of the star, although it is worth noting that Pannekoek (1906) detected hints of the star's light variations on an identical timescale in visual comparisons he made of Polaris with β UMi between 1890 and 1894. Pannekoek's 510 visual observations (Pannekoek 1913) correspond to light variations for Polaris of only 0.05 mag in that era, whereas the actual variations were probably more than twice as large (see § 4). Today's observers, who find it a challenge to detect the present low level of light variability in Polaris, even with the aid of photoelectric and solid‐state detectors, may find it difficult to imagine an era when Polaris was an optical light variable, but the evidence is irrefutable. Experiments indicate that light variations of 0.1 mag or less are within the range of detectability for a careful observer at a good site (e.g., Turner 2000). Sadly, Pannekoek published the results of his observations (Pannekoek 1913) after the optical variability of the star had been confirmed by Hertzsprung (1911) from photographic observations. Hertzsprung is therefore credited with the discovery of light variations in Polaris, although he was clearly inspired by the work of Campbell and Pannekoek.
Hertzsprung (1911) also noted the similarity of Polaris to other Cepheids that had been studied previously, although in that era, such objects were considered to be spectroscopic/eclipsing binary systems rather than pulsating stars. The earliest parameter of interest to early observers of Polaris was therefore its period of variability (e.g., Schneller 1949), which, at 3.969 days, is distressingly close to an integral number of days. Such a coincidence necessarily creates difficulties for obtaining full phase coverage of the star's light curve during the course of an observing season.
The period of variability for Polaris was not the only parameter of interest. The rate at which it was changing also became a matter of some debate. Several recent studies (Arellano Ferro 1983; Dinshaw et al. 1989; Fernie et al. 1993; Kamper & Fernie 1998) have confirmed the rapid rate of period increase in Polaris, which is orders of magnitude larger than for other Cepheids of similar period. In this paper we explore the period changes in greater detail by taking advantage of the wealth of observational data available for the star, in conjunction with new observations of its variability. As we point out here, the period changes for Polaris provide vital clues for understanding the true nature of the Cepheid.
2. OBSERVATIONAL DATA AND METHOD OF ANALYSIS
Existing observational data for Polaris are fairly complete for the interval 1900–1950, and also between 1975 and 1996, but are rather spotty for other years. We therefore made a detailed search of the available literature in order to track down as much observational data as possible for use in studying period changes in the star.
The task of studying period variations in Polaris is greatly simplified by the fact that the star's light and velocity variations are almost perfectly sinusoidal, as recognized by most early observers. Phased light and radial velocities can therefore be matched to sine or cosine functions of amplitude established by the observations themselves, in order to determine reliable times of light maximum or velocity minimum. That is the essence of Hertzsprung's method (Hertzsprung 1928; Tsesevich 1971; Berdnikov 1992). The same technique has been used previously in our studies of Cepheid period changes (e.g., Turner et al. 2001).
The study by Roemer (1965) of the orbital motion of Polaris draws together all of the radial velocity measurements of the star from 1896 to 1958 and provides detailed information on the gradual period increase of the Cepheid during that interval. We found the data summarized by Roemer to be excellent for initiating the present study of the star's period variations. A much earlier study by Hartmann (1901) includes radial velocities by Vogel and Scheiner from 1888 (Scheiner & Vogel 1895), but the data consist of only two velocities that are unsuited to a study of period changes in Polaris, so they were omitted from the analysis.
The 29.6 yr orbital motion of Polaris about its unseen companion has now been followed over several cycles, and the orbital parameters appear to be established fairly precisely, according to studies by Kamper (1996) and Wielen et al. (2000), including the orientation of the orbit to the plane of sky and the direction in which it is traced out. In the present analysis, we used the orbital parameters summarized by Wielen et al. (2000) to remove the effects of orbital motion from the observable data for Polaris, and also to account for light travel time effects on the times of velocity minimum and light maximum.
The effect of orbital motion on the measured radial velocities of Polaris is generally small over a single observing season, but for consistency we decided to remove its influence from all measured velocities of the star, namely those summarized by Roemer (1965), in addition to more recent measures by Arellano Ferro (1983), Kamper et al. (1984), Dinshaw et al. (1989), Gorynya et al. (1996), Kamper (1996), and Kamper & Fernie (1998). The observed radial velocities were restricted temporally, generally to intervals of about half a year, depending on data coverage. The data were then phased according to the star's ephemeris (see below), and velocity amplitudes for each epoch were established through Fourier analysis. The resulting phased velocity data were next analyzed by least‐squares techniques (see above) to establish times of velocity minimum. To a first approximation, they should be close to the corresponding times of light maximum, but as noted by Arellano Ferro (1983, 1984), there is a small phase offset that must be taken into account.
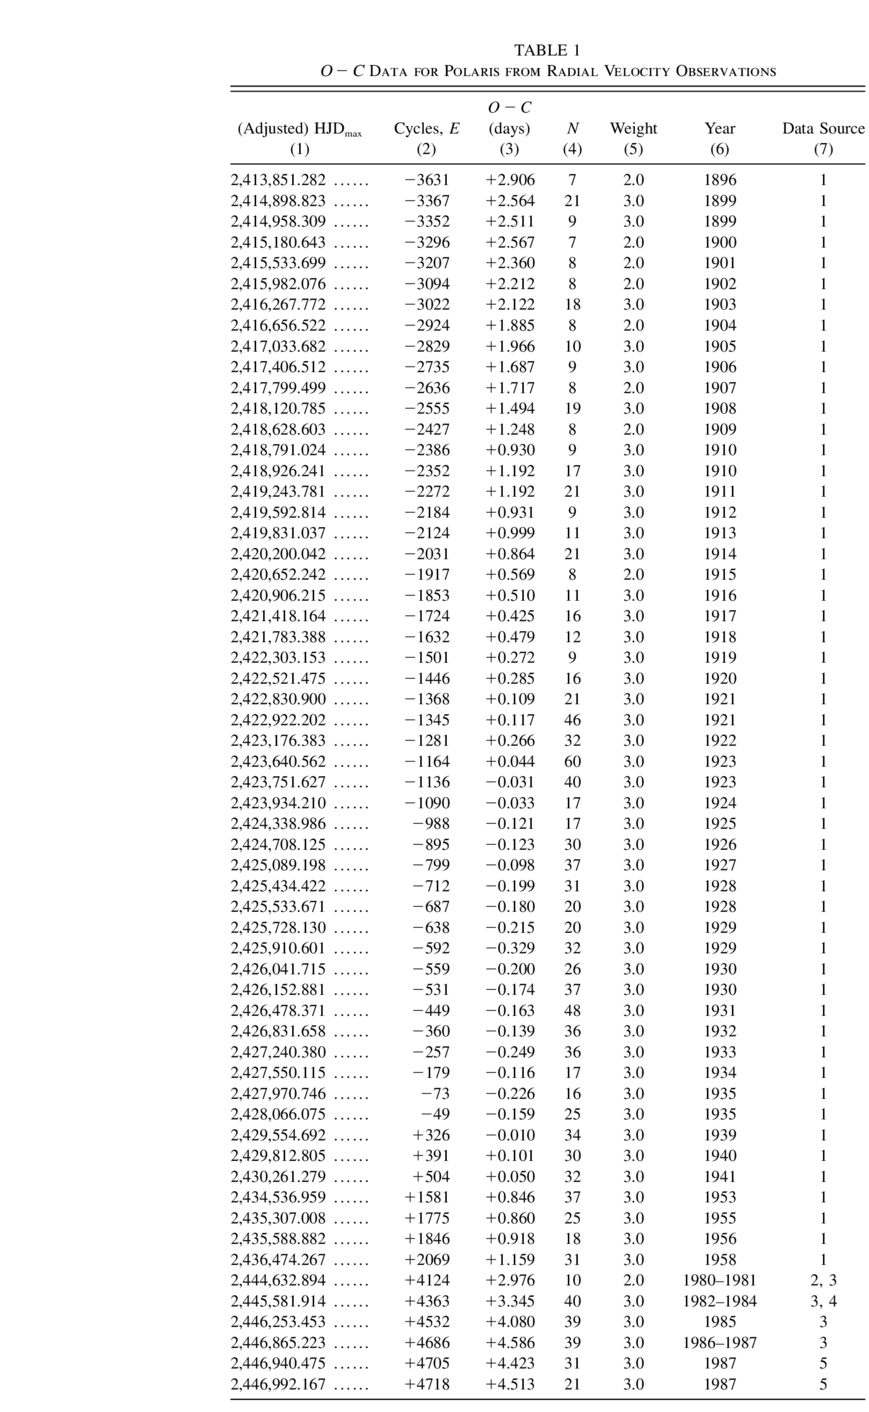
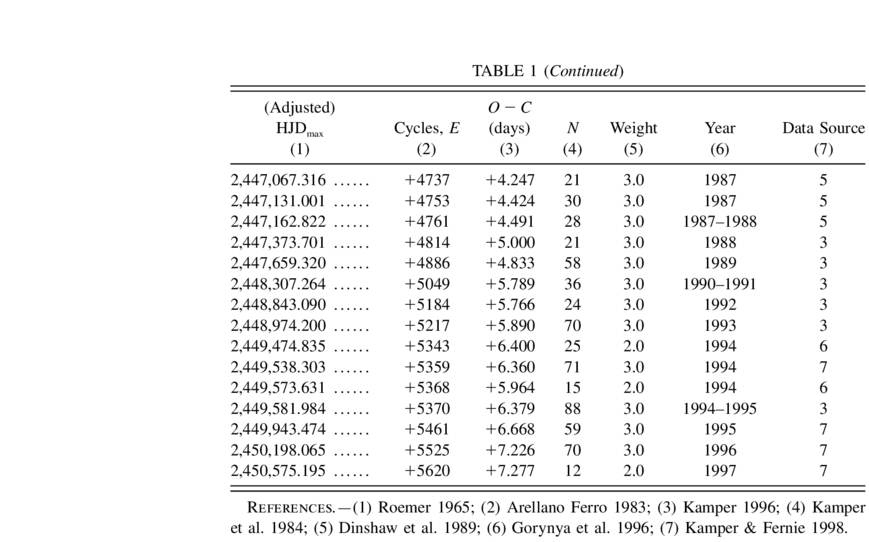
In the study of Polaris by Arellano Ferro (1983), a phase offset of −0.21 days was adopted to adjust observed times of velocity minimum for Polaris to corresponding times of light maximum, to permit a precise intercomparison of residuals from radial velocity and brightness observations of the star. The accuracy of the adopted offset is not cited by Arellano Ferro, and in a study of several similar Cepheids (Arellano Ferro 1984), he found a range of values for the offset. Kamper & Fernie (1998) cite a value of −0.333 days for the offset used in their analysis, while a study by Sachkov (2000) implies a period dependence for the offset that yields an estimate of −0.436 ± 0.080 days for a Cepheid with the pulsation period of Polaris. For the present study, we established an independent correction for the phase offset through a detailed comparison of the O - C residuals for the times of velocity minimum and light maximum measured anew for this paper. A best estimate of −0.383 ± 0.027 days, similar to the Kamper & Fernie (1998) and Sachkov (2000) results, was found from an analysis of 42 inflection points. Adjustments of that amount were therefore applied to establish the times of "light maximum" (HJDmax) listed in Table 1, as derived from radial velocity measures for Polaris. The values of HJDmax cited in column (1) of Table 1 therefore represent times of velocity minimum for Polaris that correspond to the epoch lying closest to the middle of the observing season analyzed, with the radial velocities adjusted for the orbital motion of the star, and the times adjusted for a constant phase offset from light maximum of −0.383 days and for light travel time effects relative to the system barycenter.
 |
 |
In similar fashion, we reanalyzed all existing sources of photometric data for Polaris, in the process regrouping the data, where possible, into shorter time intervals, rephasing the observations according to the ephemeris given by Berdnikov & Pastukhova (1995), which is

(where E is the number of elapsed cycles), and determining new light amplitudes and phases of maximum light from the observations using Fourier and least‐squares techniques. The method of deriving phase offsets for maximum light from phased photometric data (Berdnikov 1992; Turner et al. 2001) is fairly robust and is relatively independent of any differences between the light amplitude of the standard curve and that obtained from the observations. Nevertheless, we analyzed both the radial velocity and photometric observations first by Fourier techniques to establish the proper amplitude for the best‐fitting sine function, then by least‐squares techniques to establish the correct phase offset for each data set.
Included in the latter data sample are times of light maximum derived from the observations of Schmidt (1857), who presents dates of maximum and minimum for the star, in addition to estimates of its brightness at the beginning of each calendar month, for the interval 1844–1856, omitting 1854. It would be a simple matter to dismiss Schmidt's results, as was done by Fernie et al. (1993), on the grounds that they do not meet present standards of publication. But short of searching archives for Schmidt's old research records, which may no longer exist, there is no direct way of establishing the period variations of Polaris during the mid‐19th century.
Johann Friedrich Julius Schmidt (1825–1884), who was better known for his lunar observations, set up a long‐term program of visual observation of Polaris during a period when he was employed at observatories in Düsseldorf and Bonn in Germany, and at Olmütz in today's Czech Republic. The data indicate that Schmidt made his observations at about the same time each clear evening, as was and is a common practice for a long‐term project. Individual brightness estimates are not given, but he does list mean differences between α and β UMi for the start of each month, using units of the step values he employed in his observations. The mean step difference between α and β was about 1.2 units in his 1844 and 1845 observations, but was only 0.7 units after he modified his scale to match a scheme employed by Argelander. The human eye can detect brightness differences of 0.1 mag, and under ideal conditions differences of perhaps 0.07 mag (e.g., Turner 2000). Since α and β differ by 0.07 mag at present, it appears from his observations that Schmidt employed the coarser scale unit in his later measurements, but was using a finer scale unit for his early measurements.
The inferred visual light amplitude for Polaris from Schmidt's observations is about 0.22 mag, of which a component amounting to about 0.10 or 0.12 mag can be attributed to differential atmospheric extinction between α and β during the course of the year, according to our estimates for the likely visual extinction coefficients at Schmidt's observing sites. Schmidt therefore appears to have detected a visual amplitude for the light variations of Polaris amounting to 0.10–0.12 mag, in excellent agreement with more recent observations of the light amplitude of Polaris prior to 1966 (see § 4).
Schmidt's data indicate that Polaris was consistently the brighter of the two stars in late August, and the fainter of the two in late April. Such differences can be attributed to differential atmospheric extinction between the two stars over the course of a year, which would explain the apparent periodicity obtained by Schmidt from his observations. The annual dates of light maximum and minimum for Polaris should correspond to times of lower and upper culmination, respectively, for β UMi relative to Polaris, in which case Schmidt must have made his observations at very close to 0 hours UT each night, with a high degree of regularity. An exception appears to be his observations during the autumn months, in which he seems to have made his estimates earlier in the evening, possibly because of fluctuating weather conditions. Any other conclusions are inconsistent with the high degree of uniformity in Schmidt's tabulated annual dates for light maximum and minimum. By all indications, Schmidt was very conscientious in attempting to tie his observations to the beginning of the day in Universal Time.
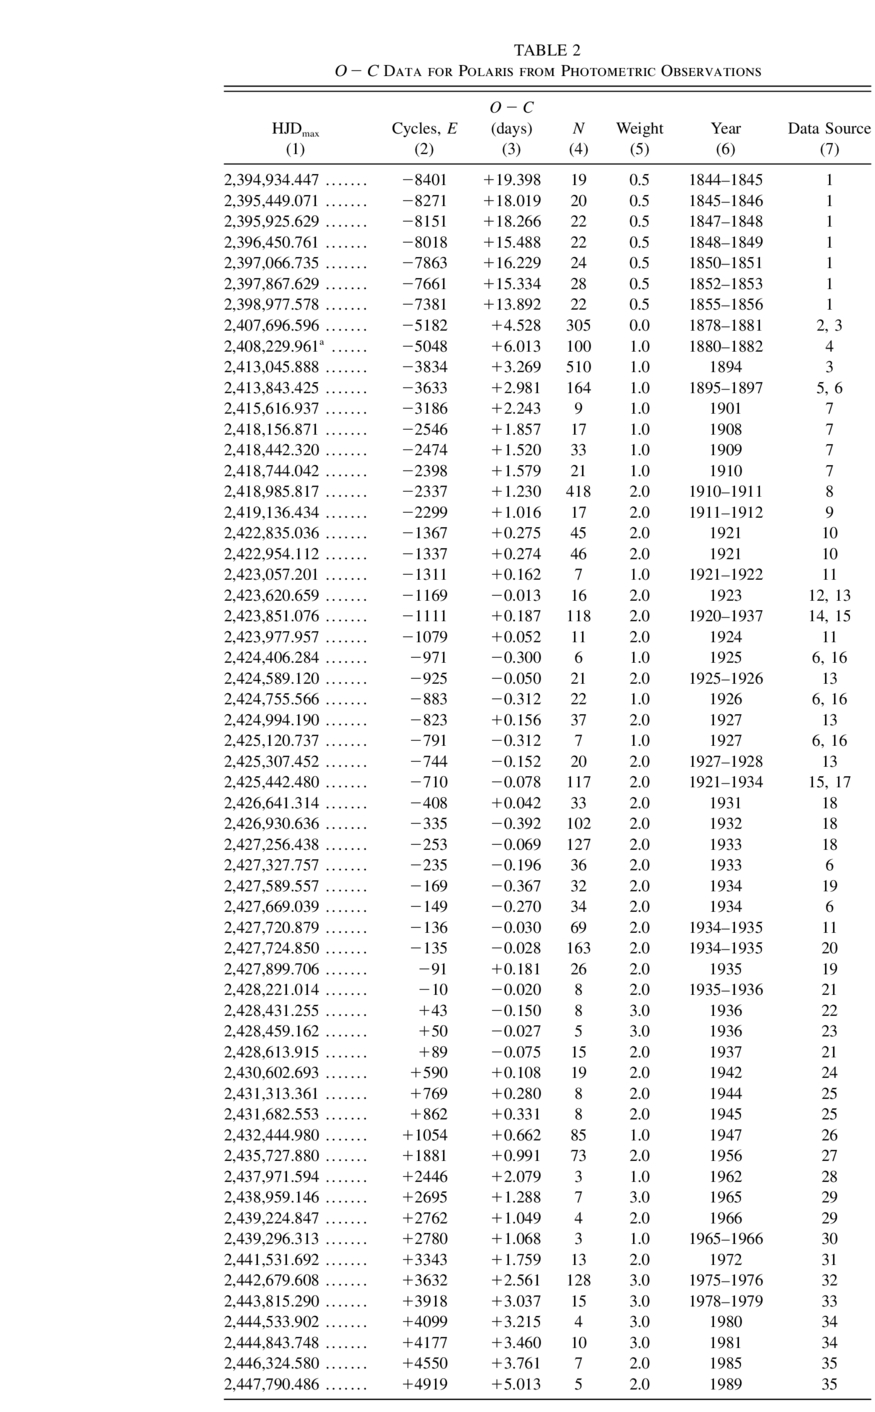
Schmidt's observations therefore appear to be both reasonable and useful, given the method he employed. Since Polaris has a sinusoidal light curve and a period that is close to an even integral number of days, averages for its brightness taken over many days should yield values very close to its true brightness on the mean dates of observation, with a smaller uncertainty than would be the case for individual observations. Schmidt's estimates for the brightness of Polaris at the beginning of each month are therefore as valuable as his cited dates for when the star reached maximum and minimum brightness during the course of a year. In such fashion, one can establish brightness estimates for Polaris on anywhere from 10 to 17 nights per year from Schmidt's tabulation, with times of observation good to within an hour or two (at worst). We found that it was possible to estimate reasonably accurate times of light maximum for Polaris from Schmidt's observations by phasing them to a sine function tied to the ephemeris of equation (1). The resulting dates are included in Table 2.
 |
 |
The only source of uncertainty in the use of Schmidt's observations is possibly incorrect cycle count, since the observations are so remote temporally. The adopted cycle count may seem arbitrary, but was chosen primarily to minimize scatter in the O - C data from one time interval to another relative to any reasonable functional dependence fitting the period changes. For consistency with the other times of HJDmax given in Table 2, we have also cited the dates to the same number of significant figures as our other estimates. Examples of light curves for Polaris obtained from Schmidt's data are presented in Figure 1, along with less reliable visual brightness estimates by Selivanov (1936) and much more precise photoelectric observations by de Vaucouleurs (1947), shown for comparison. As noted earlier, Schmidt's method of averaging his data to the beginning of each month actually serves to reduce the scatter present in his individual observations.

Fig. 1.— Visual observations of Polaris, inferred from the averaged data tabulated by Schmidt (1857) for the time intervals 1844–1845 and 1852–1853 and phased according to eq. (1), compared with individual visual observations tabulated by Selivanov (1936) for 1931 and with photoelectric observations by de Vaucouleurs (1947) for 1942. The illustrated sine functions represent best fits to the data.
There are two oft‐cited times of light maximum prior to 1900 that prove to be problematic: that attributed to Müller (1883) by Pannekoek (1913), and that of Pickering (1912). The data from Müller (1883) are problematic inasmuch as they imply an overly small light amplitude derived from photographic observations. The smoothed light curve may therefore be spurious. The inferred time for light maximum also appears to be a half‐cycle from the expected value, which raises the possibility that the average magnitude differences cited by Pannekoek (1913) were accidentally inverted in a transcription from the original. We have therefore given that result zero weight in our analysis. The value from Pickering (1912) is more easily analyzed, since it involves an erroneous application of Hertzsprung's method to the original data. A correct application was used to derive the results cited in Table 2.
Collmann (1934) presents observations of Polaris at wavelengths corresponding to the ultraviolet, blue, and deep red regions of the spectrum. We were unable to obtain data from the paper that were of much use in our analysis. Collmann's light curve is decidedly asymmetric relative to the sinusoidal light curves obtained by other authors. It was therefore decided to omit those observations from the analysis.
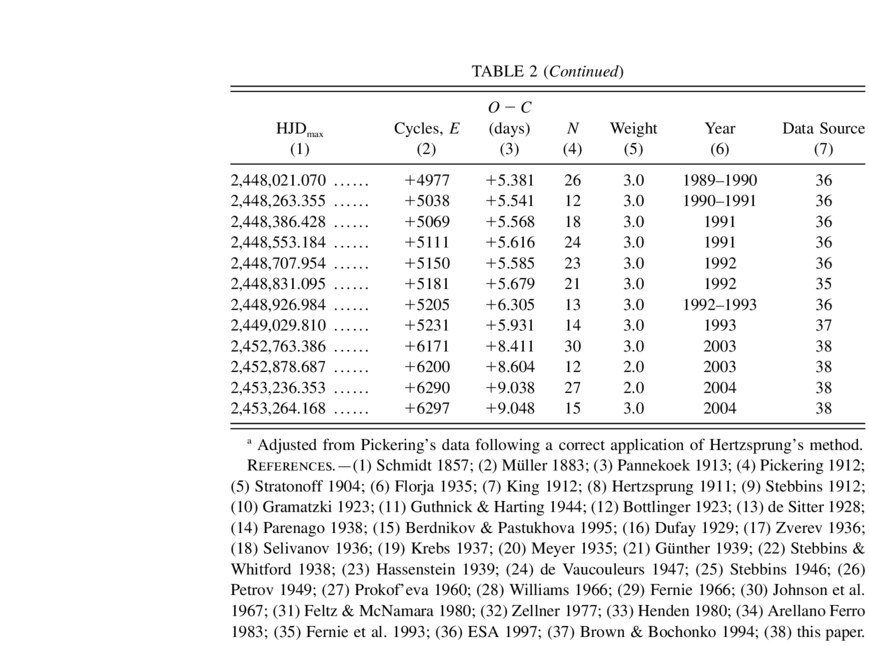
The newly derived times for HJDmax are cited in column (1) of Table 2, and, like the data of Table 1, include small corrections to the system barycenter in order to remove light travel time effects. In most cases the results were obtained from new analyses of the original archival data, but for a number of cases in which the data were not accessible, we adopted cited times of HJDmax from the literature, corrected for light travel time effects as in the other cases. We made a similar analysis of the newly obtained data described in § 3, with the results presented in the last lines of Table 2.
Weights were assigned to the resulting O - C estimates in Tables 1 and 2, following the scheme adopted by Szabados (1977). It is based on the number of data points, the quality of the data (as judged by the observational scatter), and the relative completeness of the light or velocity curves. Values obtained from observations by Schmidt (1857) were assigned a relatively low weight, and the cited results from Müller's observations (Müller 1883; Pannekoek 1913) were given zero weight in our analysis, for reasons described above. The weights assigned to the values obtained from Schmidt's observations could be set to zero without affecting the results of this paper. Their principal role is to demonstrate the probable consistency of the period changes in Polaris over the past century and a half.
3. NEW OBSERVATIONS
New photometry of Polaris was obtained between 2003 February and 2004 September using an Optec SSP‐3 solid‐state photometer attached to the 0.4 m reflecting telescope of the Burke‐Gaffney Observatory at Saint Mary's University. The photometer is equipped with standard UBV filters, although for most observations, we obtained only B‐ and V‐band data. The number of usable nights was dictated by the weather and by the higher priority use of the telescope for public observing and undergraduate observing exercises. Since the sky transparency at a sea level site such as Halifax varies both nightly and hourly, depending on the atmospheric water vapor content, we tied all observations to HR 286 (HD 5914, BD +88°04, spectral type = A3 V, V = 5.86), which is similar enough in color and proximity to Polaris to be a suitable reference star. HR 286 is the same comparison star used by Hertzsprung (1911) in his confirmation of the light variability of Polaris. In all cases, we also took into account slight differences in air mass between the reference star and Polaris in reducing the observations to the standard system.
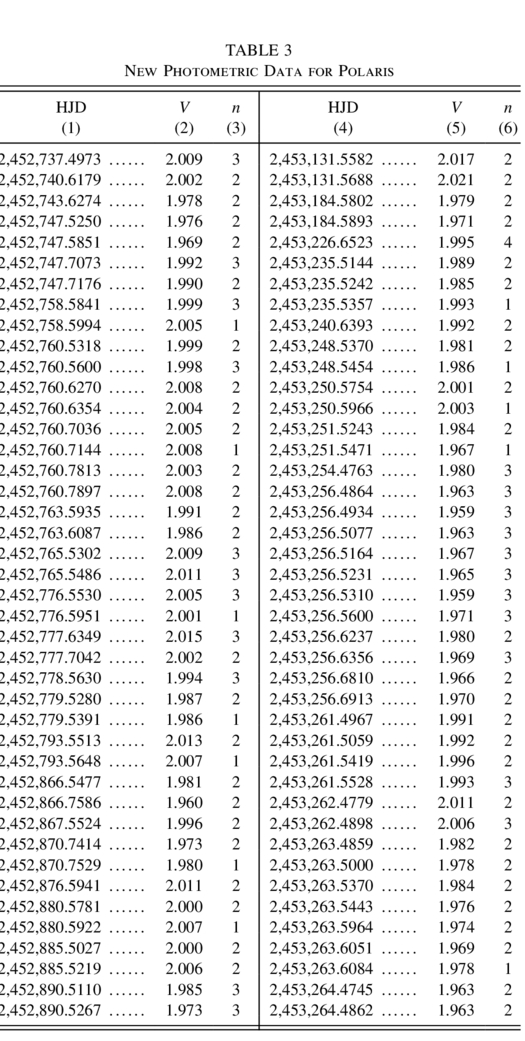
The uncertainties in the photometry are estimated to be no larger than ±0.01 mag, and in most cases, particularly for observations by the lead author, are probably less than ±0.005 mag, as judged by the tight quality of the resulting light curves. The new observations presented in Table 3 are standardized in V relative to HR 286, with the number of individual observations on which the values are based cited in columns (3) and (6). In all cases, a single observation represents three individual integrations of the star through both B and V filters, and six to nine individual integrations on the reference star for comparison. Final color transformations for the site are still being evaluated, so we list only V‐band data here. Full BV data will be presented elsewhere.
 |
Light curves for the new observations are shown in Figure 2, and the resulting O - C data are given in the last rows of Table 2. A discussion of the results is given below.

Fig. 2.— Observations of Polaris made at Saint Mary's University during 2003–2004. The observations are temporally restricted to the cycle intervals indicated, with the bottom set corresponding to 4 consecutive nights over a single cycle. Sine waves correspond to best fits to the data.
4. RESULTS
The O - C values based on the radial velocity data summarized by Roemer (1965) are illustrated in Figure 3, where the data are taken from the first 53 lines of Table 1. It should be clear from Figure 3 that the period variations in Polaris during the interval 1896–1958 are described very closely by a regular period increase of 4.48 ± 0.06 s yr−1, as indicated by the close‐fitting, positively sloped parabolic curve that matches the observations.

Fig. 3.— O - C diagram for Polaris, based solely on radial velocity measurements summarized by Roemer (1965). The fitted parabolic relation corresponds to a period increase of 4.48 ± 0.06 s yr−1. Symbol size is proportional to the assigned weight of each datum.
An identical result is obtained when one includes O - C data from photometric observations covering the interval 1844–1963 (first 49 lines of Table 2). The combined radial velocity and photometric results, depicted in Figure 4, are matched by a parabolic fit describing a period increase of 4.45 ± 0.03 s yr−1. A number of very small deviations of the data from a best‐fitting parabola are at the limit of detectability, but are in the same sense as the light travel time corrections made to the observations, only of slightly smaller amplitude. Conceivably, they might be related to the 45 day period found by Dinshaw et al. (1989) in their observations, although it seems unlikely. More importantly, they may indicate the need for further refinements to the spectroscopic orbit, but that is beyond the scope of the present study.

Fig. 4.— O - C diagram for Polaris from combined radial velocity measurements (circles) and photometric observations (squares) made prior to 1963. Symbol size is again proportional to assigned weight for each datum, with the smallest point having an assigned weight of zero. The fitted parabolic relation corresponds to a period increase of 4.45 ± 0.03 s yr−1.
The situation described for the 1844–1963 observations changes when one includes O - C data from observations made since 1963. The full data set from Tables 1 and 2 is illustrated in Figure 5, from which it should be evident that the smooth parabolic relationship describing the early observations does not match data from the past 40 yr. It is possible to fit the data using a third or fourth order polynomial, as suggested for example for Y Oph by Fernie (1990) and for WZ Car by Berdnikov & Turner (2004). But such a fit would mask the very obvious break in the data around 1963, following which there appears to have been a period decrease for a few years, followed by a resumption of the period increase at a rate estimated to be 4.28 ± 0.73 s yr−1 (4.71 ± 0.63 s yr−1 if the datum from 1966 is included).

Fig. 5.— O - C diagram for Polaris, based on all observations summarized in Tables 1 and 2. Symbols are as in Figs. 3 and 4. The parabolic relation fitting observations prior to 1963 is that of Fig. 4. The parabolic relation fitting observations since 1963 corresponds to a period increase of 4.28 ± 0.73 s yr−1.
The close similarity in all estimates for the rates of period increase for Polaris both before and after the brief hiatus from 1963 to 1966 (the values agree to within their uncertainties) suggests that the redward evolution of Polaris through the instability strip has remained relatively constant, with a rate of period increase of 4.5 s yr−1, except for a brief interlude of 3 or 4 yr, when the period readjusted downward to a value of 3.9661 days before beginning to increase monotonically again at the same rate as before the hiatus. Such a change might occur, for example, if the star's regular evolution across the H‐R diagram was interrupted by a short‐lived interval of blueward evolution associated with a small change in average radius amounting to −0.055%. Alternatively, a sudden increase in the mass of the star by the equivalent of, say, the assimilation of a 7MJ planet could accomplish an identical result. The rather large rate of period increase for Polaris is otherwise consistent with predictions from stellar evolutionary models (see, e.g., Szabados 1983; Turner & Berdnikov 2001, 2003, 2004), provided that it is crossing the instability strip for the first time and lies toward the cool edge of the instability strip for first crossers.
Further insight into the 1963–1966 hiatus is provided by information on the changing light amplitude of Polaris. As a side product of the data analysis for the radial velocity and photometric observations, we were able to establish the light amplitude, ΔV, for most of the individual data sets, in the case of the radial velocity data by using the correlation between radial velocity half‐amplitude and full light amplitude of ΔV = ΔVR(km s-1)/50 found by Fernie et al. (1993). Kamper & Fernie (1998) subsequently revised the correlation constant in the relationship to 50.6 ± 1.6 km s−1 mag−1, but continued to use a value of 50 in their work, so the same value was adopted here. The results obtained from analyses of the radial velocity data, visual observations, photographic observations (using ΔV = ΔB/1.45), and V‐band photometry are plotted in Figure 6.

Although it has generally been assumed by most previous researchers that Polaris has undergone a slow secular decrease in its light amplitude (e.g., Arellano Ferro 1983; Dinshaw et al. 1989; Fernie et al. 1993; Kamper & Fernie 1998), the full data set presents a different picture. Up until 1963, Polaris displayed a nearly stable, or perhaps slowly decreasing, light amplitude of ΔV≥0.10 mag, following which it began to vary erratically and at smaller amplitude. The timing of the short hiatus in its period increase from 1963 to 1966 coincides closely with the change in behavior of its light amplitude to the presently lower and erratic state. There is very little indication in the observational record since 1966 that the light amplitude is declining monotonically. If anything, it seems to have become both smaller and erratic in nature. Recent photometry has even led to the suggestion that the amplitude may be increasing (Davis et al. 2003; Engle & Guinan 2004), but the evidence is marginal.
This last point can explain observations of the star in the 1990s, when it was proposed that the variability might cease entirely before the turn of the millennium (Dinshaw et al. 1989; Fernie et al. 1993), although that speculation was subsequently modified by Kamper & Fernie (1998). The observations presented in Table 3 and Figure 2 suggest that the light amplitude may change from one pulsation cycle of Polaris to another. For cases in which observations are combined over several cycles, there is large scatter in the light curves that is greater than what is predicted by observational uncertainties. But for cases in which the star was observed over a single cycle (e.g., number 6296‐97, during a 4 night interval), the light curve is extremely tight, with internal scatter no larger than the observational uncertainties.
Recent observations of Polaris by Evans et al. (2004) with the Wide Field Infrared Explorer (WIRE) star camera confirm the above suggestion. Evans et al. (2004) find from regular monitoring of Polaris that its light amplitude decreases and increases during the course of a month of observation. Additional observations of Polaris would seem to be essential for exploring this intriguing behavior further, and also for establishing if there is an upward trend in the recent light amplitude of the pulsations.
5. DISCUSSION
Much of the literature on Polaris in the past two decades has discussed the rate of period increase for the Cepheid, and its pulsation status. The small amplitude and sinusoidal light curve of the variable, in conjunction with an Hipparcos parallax (ESA 1997) indicative of a luminosity well in excess of that for a fundamental‐mode pulsator (Feast & Catchpole 1997), are generally considered to indicate pulsation in an overtone mode (Kamper & Fernie 1998; Evans et al. 1998, 2002; Moskalik & Ogloza 2000). The reddening of Polaris is small to negligible (Turner 1977; Gauthier & Fernie 1978), and its colors place it near the center of the instability strip as a fundamental‐mode pulsator, or toward the hot side of the strip as an overtone pulsator.
The chemical composition of the atmosphere of Polaris is basically of solar metallicity, but with a carbon deficiency and nitrogen overabundance indicating the presence of CNO‐cycle products (Luck & Bond 1986). Polaris is therefore typical of other classical Cepheids, which all appear to display various degrees of contamination by CNO‐processed material in their atmospheres (Turner & Berdnikov 2004). Such contamination seems to be associated with meridional mixing during their previous evolutionary stages as rapidly rotating main‐sequence B‐type stars and cannot be used, for example, to isolate the instability strip crossing mode for Polaris.
The rapid rate of period increase in Polaris and the evidence for a marked decline in its light amplitude in recent years are characteristics that must be accounted for in order to understand its current state of evolution. Initial speculation by Arellano Ferro (1983) was that either the amplitude was fluctuating or the star was evolving off the cool edge of the instability strip. The latter received strong support from Dinshaw et al. (1989). But Fernie et al. (1993) correctly pointed out that Polaris lies near the center of the observationally defined instability strip as a fundamental‐mode pulsator, from which it was speculated that light amplitude might not be diagnostic of location within the strip. With the results of Feast & Catchpole (1997), Kamper & Fernie (1998) speculated that Polaris might be evolving through the red edge of the instability strip for first overtone pulsators into the instability strip for fundamental‐mode pulsators. Similar conclusions were reached by Evans et al. (1998, 2002).
Another method of identifying pulsation modes in Cepheids that has been used extensively in recent years involves the use of Fourier parameters to distinguish between fundamental‐mode pulsation and overtone pulsation (e.g., Simon & Lee 1981; Antonello et al. 1990). The parameters for Polaris are consistent with overtone pulsation (e.g., Moskalik & Ogloza 2000), yet the case is not that simple. As noted by Sandage et al. (2004), if a light curve is a perfect sine or cosine wave, there is only one term in the matching Fourier series (by implication, the Fourier parameter ϕ21 becomes meaningless). In addition, "small‐amplitude Cepheids generally have more symmetrical light curves than those of large amplitude" (Sandage et al. 2004), which makes it difficult to employ Fourier parameters as a means of identifying pulsation modes in small‐amplitude variables such as Polaris.
There is growing independent evidence that Polaris is closer than the 132 ± 8 pc distance implied by its Hipparcos parallax (Engle & Guinan 2004; Turner 2004). New estimates for its distance give values consistently near 94 ± 4 pc. The evidence for a closer distance can be summarized as follows. There is a previously unnoticed sparse cluster of A‐ and F‐type dwarfs in the immediate vicinity of Polaris (Turner 2004). The proper motions of the stars are identical in magnitude and direction to that of Polaris (Engle & Guinan 2004), and for observations that exist, are also the same in radial velocity (Engle & Guinan 2004; Turner 2004). The space motions of Polaris and nearby cluster dwarfs are consistent with membership in the Pleiades moving group (Engle & Guinan 2004), and the weighted mean Hipparcos parallax for cluster stars of 9.36 ± 0.30 mas (7.56 ± 0.48 mas for Polaris alone) implies a distance similar to the value of 94 ± 4 pc obtained from main‐sequence fitting for the AF dwarfs. There are other AF dwarfs in the vicinity of Polaris, at about the same distance as implied by the Hipparcos parallax for Polaris, but their proper motions and radial velocities are markedly different from the values for Polaris (Turner 2004). Either the star's space velocity or its parallax must be anomalous.
Group parallaxes are generally preferable to individual parallaxes, where available, and in the case of Polaris, they imply a problem with the star's parallax as measured by Hipparcos. There is evidence that the actual uncertainties in the Hipparcos parallaxes are larger than estimated (Turner & Burke 2002), and for some star clusters may be systemically offset from the true absolute parallaxes (Makarov 2002, 2003; Schilling 2004). Szabados (1997) has also noted problems with the Hipparcos parallaxes for binary Cepheids, Polaris included.
At a distance of 94 ± 4 pc, the inferred luminosity for Polaris is 〈MV〉 = -2.94 ± 0.09, identical to what one expects for a fundamental‐mode pulsator. The angular diameter of Polaris derived by Nordgren et al. (2000) corresponds to a radius of 33 ± 2 R⊙ at that distance, again consistent with the value expected for a fundamental‐mode pulsator with the pulsation period of Polaris. It seems logical to examine the period changes in Polaris as a characteristic of fundamental‐mode pulsation.
A variety of possible causes have been attributed to Cepheid period changes, including a suggestion by Evans et al. (2002) that overtone pulsators may exhibit larger rates of period change than other Cepheids, owing to rapid changes in the growth rates of the overtone modes near the surfaces of such stars. In fact, almost all Cepheid period changes can be matched extremely well to predictions from stellar evolutionary models for stars evolving through the Cepheid instability strip (Szabados 1983; Turner 1998; Turner & Berdnikov 2001, 2003, 2004). The most rapid rates of period change at a given period and strip crossing correspond to Cepheids lying on the hot edge of the instability strip. Such stars are more massive than Cepheids of comparable period lying on the cool edge of the strip, so they evolve more rapidly for a given crossing mode. Cepheids of a given instability strip crossing mode tend to exhibit rates of period change that lie within factors of ±4 of predictions for stars lying in the center of the instability strip, the scatter arising from the finite width of the instability strip.
The observed rate of period increase for Polaris of 4.5 s yr−1 is about half the value expected from model predictions for a star in the first crossing of the instability strip, provided that the star is a fundamental‐mode pulsator. By way of comparison, the average rate of period increase for stars of similar period likely to be in the third crossing of the instability strip (see Turner & Berdnikov 2001, 2003, 2004) is only 0.080 ± 0.021 s yr−1, 2 orders of magnitude smaller. The rate for putative fifth crossers of the same period is not much larger. If Polaris were an overtone pulsator, its rate of period increase would be a factor of 3 smaller than the value expected for a first crosser, once again overly large for a star in the third crossing of the instability strip, but within a factor of 2 of what is observed for stars in the putative fifth crossing. The observed rate of period increase for Polaris is generally consistent with stellar evolutionary predictions, but the solution that agrees most closely with its observable characteristics would associate the star with a first crossing of the instability strip.
According to stellar evolutionary calculations, the number of Cepheids in any given crossing mode should be proportional to the time it takes stars of Cepheid progenitor masses to evolve through the strip. The first crossing, because it is the fastest of the different possible crossings, corresponds to only a small percentage of the total sample, perhaps 1%–2% at most. Of the ∼200 Cepheids with established rates of period change, only a handful exhibit the rapid rates of period increase consistent with a first crossing. Polaris is one of three classical Cepheids identified by Turner (1998) as possible first crossers of the instability strip, on the basis of their common characteristics: sinusoidal light variations, relatively small amplitudes, and rapid rate of period increase relative to other Cepheids of comparable period. Other candidates with comparably high rates of period increase include DX Gem and BY Cas.
As noted earlier, the colors of Polaris place it near the center of the instability strip as a fundamental‐mode pulsator. In that case, why did the star undergo a hiatus in its period increase during 1963–1966 and then begin to display a marked decrease in pulsation amplitude, along with fluctuations in amplitude from cycle to cycle? Here again, evolution may be the key. The location of Polaris in the theoretical H‐R diagram is plotted in Figure 7, along with the data for DX Gem and BY Cas, for the case of both fundamental‐mode pulsation and overtone pulsation in the three stars. Estimates of space reddening are available for all three Cepheids. What distinguishes Polaris from other putative first crossers is that it falls on the cool side of that portion of the instability strip occupied by such stars, whatever its mode of pulsation. Its pulsation amplitude is also the smallest of the group. It seems natural to speculate that Polaris is in the process of evolving beyond the cool edge of the instability strip defined by first crossers, and indeed that the instability strip for first crossers encompasses a smaller range of stellar effective temperatures than that observed for Cepheids in other crossings.

Fig. 7.— Location of Polaris and other putative first‐crossing Cepheids is depicted relative to the observationally defined instability strip for all Cepheids (Turner & Berdnikov 2001), indicated by dashed lines. The placement of the first crossers is made on the basis of their space reddenings, with Polaris identified by the circled point. The location of the same stars as overtone pulsators is indicated by plus signs. First crossers appear to define a more restricted region of parameter space than other Cepheids, with Polaris falling toward the cool edge of the limited subset of variables.
If Polaris is regarded as an overtone pulsator, however, then its location within the instability strip presents serious difficulties. Its pulsation is gradually growing weaker, yet there is no evidence in existing observations for the star (Tables 2 and 3, and Evans et al. 2004) for the onset of weak pulsation at the putative fundamental‐mode period of 5.75 days, nor in the fourth overtone (Evans et al. 2004). Since the star lies very close to the center of the instability strip regardless of its pulsation mode, the lack of any periodicity other than its recognized 4 day variability presents an obstacle for its interpretation as an overtone pulsator. No such difficulties arise if Polaris is considered to be a fundamental‐mode pulsator.
Available information on rates of period change in Cepheids is consistent with fundamental‐mode pulsation in Polaris. Despite the limited size of the available sample, first crossers appear to encompass a smaller range of period change rate than Cepheids in other crossing modes (Turner & Berdnikov 2001, 2003, 2004). The rate of period change, in conjunction with a star's period of variability, also appears to be an excellent diagnostic of location within the instability strip. Perhaps Polaris has even evolved out of the instability strip as defined for first crossers. The hiatus from 1963 to 1966 marked a distinct stage in the evolution of the star, and its subsequent decline in pulsation amplitude may have coincided with the growing dominance of its pulsation by convective damping (e.g., Deupree 1980). The star is still within the instability strip for Cepheids in higher strip crossings, with an effective temperature decreasing at a rate of ∼2.6 K century−1, so its pulsations may not disappear entirely for several thousand years. The mass of a first‐crossing Cepheid is about 20% greater than that of a Cepheid of comparable period in a second or third crossing of the instability strip, according to stellar evolutionary models (e.g., Lejeune & Schaerer 2001), so the surface gravity must also be 20% greater. Pulsation efficiency might therefore be reduced for a first crosser relative to that of Cepheids in higher crossing modes, possibly accounting for the present weak pulsation in Polaris and its variability from cycle to cycle observed today.
Its seems imperative to continue the observational monitoring of Polaris in order to confirm any long‐term trends. The star appears to occupy a rather unique niche in terms of stellar evolution through the Cepheid instability strip, and its observable properties present a marvelous opportunity for learning more about how such variables behave from an evolutionary standpoint.
Support for the present study was obtained from a variety of sources, including the Offices of the Vice President, Academic and Research, and Faculty of Graduate Studies and Research at Saint Mary's University, the Student Employment Experience Program (SEEP) of the Province of Nova Scotia, the Natural Sciences and Engineering Research Council of Canada (NSERC), through a Discovery Grant to D. G. T., the International Astronomical Union, through a Travel Award to M. A. S., and the Foundation for Basic Research and State Science and Technology Program "Astronomy" of the Russian Federation (to L. N. B.), through its program of Support for Leading Scientific Schools of Russia. We are indebted to the Astronomical Data Center for the use of its online service for retrieval of archival periodicals, to the Library of the Hertzberg Institute for Astrophysics of the National Research Council of Canada for transmitting a copy of a research paper cited in this study, and to Arnie Heiser for supplying us with unpublished observations from Vanderbilt University. We gratefully acknowledge informative conversations with Ed Guinan and Scott Engel of Villanova University on the observable properties of Polaris.