
Common and Novel Markers for Measuring Inflammation and Oxidative Stress Ex Vivo in Research and Clinical Practice—Which to Use Regarding Disease Outcomes?

 ,
,
 and
and
Abstract
:
1. Introduction
2. Origin and Physiological Aspects of Oxidative Stress
2.1. Oxidative Damage, Products and Transcription Factors
2.1.1. Damage to Lipid Molecules
2.1.2. Damage to Proteins
2.1.3. Damage to DNA/RNA
2.1.4. Main Transcription Factors Involved
2.2. Antioxidant System
2.2.1. Antioxidant Enzymes
2.2.2. Antioxidants
3. Origin and Propagation of Inflammation
3.1. Immune System and Cellular Responses
3.2. Acute Phase Response and Cytokines
3.3. Acute Phase Response and Acute Phase Proteins
3.4. Role of Transcription Factors, Especially NF-κB, in Inflammation
4. Markers of OS, Relation to Disease and Practical Aspects
4.1. European Food Safety Authority (EFSA) Accepted Markers
- (a)
-
Oxidative damage to proteins assessed by direct measures, such as LC-MS-MS, to detect e.g., protein tyrosine nitration products;
- (b)
-
For oxidative damage to lipids, F2-isoprostanes, also measured by LC-MS-MS (not by ELISA due to cross-reactivity); also oxLDL by immunological methods; lipid hydroperoxides by chemiluminescence; but not e.g., MDA/TBARS (though seen as a supportive measure, i.e., together with an accepted marker), LDL oxidation ex vivo;
- (c)
-
DNA damage, as assessed by the COMET assay; not 8-OH-dHG (though accepted as a supportive marker).
4.2. Direct Markers of ROS—Primary Radicals, Hydroperoxides
4.3. Oxidized Lipids, Proteins, Lipoproteins
4.3.1. TBARS and MDA
4.3.2. Isoprostanes
4.3.3. OxLDL
4.3.4. Advanced Oxidation Protein Products (AOPP) and Protein Carbonyls (PCs)
4.4. Oxidized RNA/DNA
4.4.1. 8-OH-dG
4.4.2. COMET Assay and γH2AX
4.5. Antioxidant Enzymes and Antioxidants
4.5.1. Antioxidant Enzymes
4.5.2. Antioxidant Tests
4.6. Transcription Factors—Nrf2
4.7. “Composite” Indices, -Omics Based Markers
4.8. Dietary Indices, Questionnaires
5. Markers of Inflammation, Relation to Disease and Practical Aspects
5.1. Blood Cell Counting
5.2. Cytokines/Chemokines
5.3. Acute Phase Proteins and Acute Phase Reactants (APR)
5.4. COX-2, Endothelial Markers
5.5. Transcription Factors
5.6. Composite Markers, Indices, Omics
5.7. Questionnaires
6. Conclusions and Perspectives
-
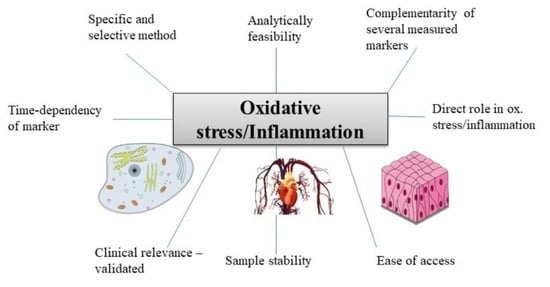
The marker chosen should have been shown in previous studies to be related to the underlying cause (e.g., disease) of the OS/inflammatory stimulus (see e.g., tables),
-
More than 1 marker of each OS and inflammation should be assessed,
-
Markers should measure complementary aspects, e.g., a cytokine and APP for inflammation, and for OS e.g., a marker of lipid oxidation (F2-isoprostane) and of DNA degradation (e.g., COMET assay),
-
The most specific and selective analysis available should be employed, e.g., chromatographic techniques should be preferred over immune-related techniques (ELISA),
-
The time-dependency of markers should be considered in acute inflammation/OS, especially for transcription factors. Preferably, multiple measures should be carried out, or at least individuals be measured at the same state/time following insult,
-
Certain markers are more indirect and complementary, i.e., biological responses to OS and inflammation, including antioxidant enzymes and compounds, and should be considered only as additional markers,
-
For samples that have been stored for prolonged periods of time (>1 y at −80 °C), the choice becomes more limited. 8-OH-dG and AOPPs for OS and APPs for inflammation may be good options in such cases.
Funding
Conflicts of Interest
Abbreviations
| 8-OH-dG | 8-Hydroxy-2′-deoxyguanosine |
| ABCB6 | ATB binding cassette, subfamily B, member 6 |
| AIDI | Anti-inflamatory dietary index |
| AOPP | Advanced oxidation protein products |
| APP | Acute phase proteins |
| APR | Acute phase reactants |
| CAD | Coronary artery disease |
| CAT | Catalase |
| CD | Crohn’s disease |
| CDAI | Composite dietar antioxidant index |
| CRP | C-reactive protein |
| COX | Cyclo-oxygenase |
| CVD | Cardio-vascular diseases |
| CYP1A | Cytochrome P450 1A |
| DAQs | Dietary questionnaires |
| DHA | Docosahexaenoic acid |
| DII | Dietary inflammatory index |
| DTNB | 5,5′-Dithiobis-(2-nitrobenzoic acid) (Ellman’s reagent) |
| EDII | Empirical dietary inflammatory index |
| ELISA | Enzyme-linked immunoassay |
| ELR | Eosinophil to lymphocyte ratio |
| EPA | Eicosapentaenoic acid |
| EPR | Electrospin-resonance |
| F2-i | F-2 isporpostanes |
| FRAP | Ferric-reducing antioxidant power assay |
| FFQ | Food frequency questionnaire |
| γH2AX | H2A histone family member X |
| GlycA | Inflammation signal in NMR |
| GPx | Glutathione peroxidase |
| GR | Glutathione reductase |
| GSH | Reduced glutathione |
| CD | Crohn’s disease |
| CVD | Cardiovascular disease |
| HII | HDL-inflammatory index |
| HMOX1 | Heme-oxygenase 1 |
| HPLC | High performance liquid chromatography |
| HO-1 | Heme-oxygenase 1 |
| IBD | Inflammatory bowel disease |
| IF | Interferon |
| IL | Interleukine |
| LPS | Lipopolysaccharides |
| LPO | Lipid peroxide |
| MBL | Mannose-binding lectin |
| MetS | Metabolic syndrome |
| MDA | Malondialdyhyde |
| MMPs | Matrix-metallo-proteinsases |
| MRP1 | Multidrug resistance associated protein 1 |
| MS | Mass spectrometry |
| NET | Neutrophil extracellular traps |
| NF-κB | Nuclear factor kappa B |
| NK | Natural killer |
| NLR | Neutrophil to lymphocyte ratio |
| NMR | Nuclear magnetic resonance |
| NOS | Nitric oxide synthase |
| NQO-1 | NAD(P)H dehydrogenase [quinone] 1 |
| Nrf2 | Nuclear factor erythroid 2 related factor 2 |
| ORAC | Oxygen radical absorbance capacity |
| OS | Oxidative stress |
| PAMPs | Pathogen-associated molecular patterns |
| PC | Protein-carbonlys |
| PGE-2 | Prostaglandin E2 |
| PPARs | Peroxisome-proliferator activated receptors |
| PUFAs | Polyunsaturated fatty acids |
| RNS | Reactive nitrogen species |
| ROS | Reactive oxygen species |
| SAA | Serum amyloid alpha |
| sICAM-1 | Soluble intercellular adhesion molecule-1 |
| SOD | Superoxide reductase |
| SRB | Scavenger receptor B |
| STAT | Signal transducers and activators of transcription |
| sVCAM-1 | Soluble vascular adhesion molecule-1 |
| T2D | Type-2-diabetes mellitus |
| TEAC | Trolox equivalent antioxidant capacity |
| TAC | Total antioxidant capacity |
| TF | Transcription factor |
| TGs | Triglycerides |
| TNF-α | Tumor necrosis factor alpha |
| TTR | Transthyretin |
| UC | Ulcerative colitis |
| UV | Ultra-violet light |
| UGT | UDP-Glycosyltransferase |
| WBCs | White blood cells |
References
- Xu, W.; Larbi, A. Immunity and Inflammation: From Jekyll to Hyde. Exp. Gerontol. 2018, 107, 98–101. [Google Scholar] [CrossRef]
- Fernandez-Sanchez, A.; Madrigal-Santillan, E.; Bautista, M.; Esquivel-Soto, J.; Morales-Gonzalez, A.; Esquivel-Chirino, C.; Durante-Montiel, I.; Sanchez-Rivera, G.; Valadez-Vega, C.; Morales-Gonzalez, J.A. Inflammation, oxidative stress, and obesity. Int. J. Mol. Sci. 2011, 12, 3117–3132. [Google Scholar] [CrossRef] [Green Version]
- Fernandez-Garcia, J.C.; Cardona, F.; Tinahones, F.J. Inflammation, oxidative stress and metabolic syndrome: Dietary modulation. Curr. Vasc. Pharmacol. 2013, 11, 906–919. [Google Scholar] [CrossRef] [PubMed]
- Oguntibeju, O.O. Type 2 diabetes mellitus, oxidative stress and inflammation: Examining the links. Int. J. Physiol. Pathophysiol. Pharmacol. 2019, 11, 45–63. [Google Scholar] [PubMed]
- Steven, S.; Frenis, K.; Oelze, M.; Kalinovic, S.; Kuntic, M.; Bayo Jimenez, M.T.; Vujacic-Mirski, K.; Helmstadter, J.; Kroller-Schon, S.; Munzel, T.; et al. Vascular inflammation and oxidative stress: Major triggers for cardiovascular disease. Oxid. Med. Cell. Longev. 2019, 2019, 7092151. [Google Scholar] [CrossRef] [Green Version]
- Tian, T.; Wang, Z.; Zhang, J. Pathomechanisms of oxidative stress in inflammatory bowel disease and potential antioxidant therapies. Oxid. Med. Cell. Longev. 2017, 2017, 4535194. [Google Scholar] [CrossRef]
- Nguyen, G.T.; Green, E.R.; Mecsas, J. Neutrophils to the ROScue: Mechanisms of NADPH oxidase activation and bacterial resistance. Front. Cell. Infect. Microbiol. 2017, 7, 373. [Google Scholar] [CrossRef] [PubMed]
- Wang, H.; Ma, S. The cytokine storm and factors determining the sequence and severity of organ dysfunction in multiple organ dysfunction syndrome. Am. J. Emerg. Med. 2008, 26, 711–715. [Google Scholar] [CrossRef]
- Cronkite, D.A.; Strutt, T.M. The regulation of inflammation by innate and adaptive lymphocytes. J. Immunol. Res. 2018, 2018, 1467538. [Google Scholar] [CrossRef]
- Pizzino, G.; Irrera, N.; Cucinotta, M.; Pallio, G.; Mannino, F.; Arcoraci, V.; Squadrito, F.; Altavilla, D.; Bitto, A. Oxidative Stress: Harms and Benefits for Human Health. Oxid. Med. Cell. Longev. 2017, 2017, 8416763. [Google Scholar] [CrossRef]
- Valko, M.; Leibfritz, D.; Moncol, J.; Cronin, M.T.; Mazur, M.; Telser, J. Free radicals and antioxidants in normal physiological functions and human disease. Int. J. Biochem. Cell. Biol. 2007, 39, 44–84. [Google Scholar] [CrossRef]
- Liu, M.; Chen, J.; Huang, D.; Ke, J.; Wu, W. A meta-analysis of proinflammatory cytokines in chronic heart failure. Heart Asia 2014, 6, 130–136. [Google Scholar] [CrossRef]
- Graham, C.; Chooniedass, R.; Stefura, W.P.; Lotoski, L.; Lopez, P.; Befus, A.D.; Becker, A.B.; HayGlass, K.T. Stability of pro- and anti-inflammatory immune biomarkers for human cohort studies. J. Transl. Med. 2017, 15, 53. [Google Scholar] [CrossRef] [Green Version]
- Zhao, Y.; He, X.; Shi, X.; Huang, C.; Liu, J.; Zhou, S.; Heng, C.-K. Association between serum amyloid A and obesity: A meta-analysis and systematic review. Inflamm. Res. 2010, 59, 323–334. [Google Scholar] [CrossRef]
- Zhou, J.; Lu, Y.; Wang, S.; Chen, K. Association between serum amyloid A levels and coronary heart disease: A systematic review and meta-analysis of 26 studies. Inflamm. Res. 2020, 69, 331–345. [Google Scholar] [CrossRef]
- Griendling, K.K.; Touyz, R.M.; Zweier, J.L.; Dikalov, S.; Chilian, W.; Chen, Y.R.; Harrison, D.G.; Bhatnagar, A. Measurement of reactive oxygen species, reactive nitrogen species, and redox-dependent signaling in the cardiovascular system: A scientific statement from the American Heart Association. Circ. Res. 2016, 119, e39–e75. [Google Scholar] [CrossRef]
- Wei, Z.; Li, X.; Li, X.; Liu, Q.; Cheng, Y. Oxidative Stress in Parkinson’s Disease: A Systematic Review and Meta-Analysis. Front. Mol. Neurosci. 2018, 11, 236. [Google Scholar] [CrossRef] [PubMed]
- Di Minno, A.; Turnu, L.; Porro, B.; Squellerio, I.; Cavalca, V.; Tremoli, E.; Di Minno, M.N. 8-Hydroxy-2-deoxyguanosine levels and cardiovascular disease: A systematic review and meta-analysis of the literature. Antioxid. Redox Signal. 2016, 24, 548–555. [Google Scholar] [CrossRef] [PubMed] [Green Version]
- Matsumoto, Y.; Ogawa, Y.; Yoshida, R.; Shimamori, A.; Kasai, H.; Ohta, H. The stability of the oxidative stress marker, urinary 8-hydroxy-2′- deoxyguanosine (8-OHdG), when stored at room temperature. J. Occup. Health 2008, 50, 366–372. [Google Scholar] [CrossRef]
- Pisoschi, A.; Negulescu, G. Methods for total antioxidant activity determination: A review. Biochem. Anal. Biochem. 2012, 1, 106. [Google Scholar] [CrossRef] [Green Version]
- Ighodaro, O.M.; Akinloye, O.A. First line defence antioxidants-superoxide dismutase (SOD), catalase (CAT) and glutathione peroxidase (GPX): Their fundamental role in the entire antioxidant defence grid. Alex. J. Med. 2018, 54, 287–293. [Google Scholar] [CrossRef] [Green Version]
- Winklhofer-Roob, B.M.; Faustmann, G.; Roob, J.M. Low-density lipoprotein oxidation biomarkers in human health and disease and effects of bioactive compounds. Free Radical. Biol. Med. 2017, 111, 38–86. [Google Scholar] [CrossRef] [PubMed]
- Gao, S.; Zhao, D.; Wang, M.; Zhao, F.; Han, X.; Qi, Y.; Liu, J. Association Between Circulating Oxidized LDL and Atherosclerotic Cardiovascular Disease: A Meta-analysis of Observational Studies. Can. J. Cardiol. 2017, 33, 1624–1632. [Google Scholar] [CrossRef] [PubMed]
- Mutter, F.E.; Park, B.K.; Copple, I.M. Value of monitoring Nrf2 activity for the detection of chemical and oxidative stress. Biochem. Soc. Trans. 2015, 43, 657–662. [Google Scholar] [CrossRef] [Green Version]
- Wu, D.; Wu, P.; Zhao, L.; Huang, L.; Zhang, Z.; Zhao, S.; Huang, J. NF-kappaB Expression and Outcomes in Solid Tumors: A Systematic Review and Meta-Analysis. Medicine 2015, 94, e1687. [Google Scholar] [CrossRef]
- Almeida, M.; Soares, M.; Ramalhinho, A.C.; Moutinho, J.F.; Breitenfeld, L.; Pereira, L. The prognostic value of NRF2 in breast cancer patients: A systematic review with meta-analysis. Breast Cancer Res. Treat. 2020, 179, 523–532. [Google Scholar] [CrossRef] [PubMed]
- Sánchez-Rodríguez, M.A.; Mendoza-Núñez, V.M. Oxidative Stress Indexes for Diagnosis of Health or Disease in Humans. Oxid. Med. Cell. Longev. 2019, 2019, 4128152. [Google Scholar] [CrossRef] [PubMed]
- Recasens, M.; Lopez-Bermejo, A.; Ricart, W.; Vendrell, J.; Casamitjana, R.; Fernandez-Real, J.M. An inflammation score is better associated with basal than stimulated surrogate indexes of insulin resistance. J. Clin. Endocrin. Metab. 2005, 90, 112–116. [Google Scholar] [CrossRef] [Green Version]
- Ljungstrom, E.; Pihl Lesnovska, K.; Fredrikson, M.; Hollman Frisman, G.; Hjortswang, H. Is QUOTE-IBD a valid questionnaire for measurement of quality of care in IBD? A validation study of the Swedish version. Scand. J. Gastroenterol. 2019, 54, 1245–1249. [Google Scholar] [CrossRef]
- Corley, J.; Shivappa, N.; Hebert, J.R.; Starr, J.M.; Deary, I.J. Associations between Dietary Inflammatory Index Scores and Inflammatory Biomarkers among Older Adults in the Lothian Birth Cohort 1936 Study. J. Nutr. Health Aging. 2019, 23, 628–636. [Google Scholar] [CrossRef] [Green Version]
- Phaniendra, A.; Jestadi, D.B.; Periyasamy, L. Free radicals: Properties, sources, targets, and their implication in various diseases. Indian J. Clin. Biochem. 2015, 30, 11–26. [Google Scholar] [CrossRef] [Green Version]
- Schneider, C. An update on products and mechanisms of lipid peroxidation. Mol. Nutr. Food Res. 2009, 53, 315–321. [Google Scholar] [CrossRef] [PubMed] [Green Version]
- Ayala, A.; Munoz, M.F.; Arguelles, S. Lipid peroxidation: Production, metabolism, and signaling mechanisms of malondialdehyde and 4-hydroxy-2-nonenal. Oxid. Med. Cell. Longev. 2014, 2014, 360438. [Google Scholar] [CrossRef] [PubMed]
- Eckl, P.M.; Bresgen, N. Genotoxicity of lipid oxidation compounds. Free Radical. Biol. Med. 2017, 111, 244–252. [Google Scholar] [CrossRef] [PubMed]
- Jadoon, S.; Malik, A. A comprehensive review article on isoprostanes as biological markers. Biochem. Pharmacol. 2018, 7. [Google Scholar] [CrossRef]
- Fruhwirth, G.O.; Loidl, A.; Hermetter, A. Oxidized phospholipids: From molecular properties to disease. Biochim. Biophysica. Acta 2007, 1772, 718–736. [Google Scholar] [CrossRef] [PubMed] [Green Version]
- Philippova, M.; Resink, T.; Erne, P.; Bochkov, V. Oxidised phospholipids as biomarkers in human disease. Swiss Med. Wkly. 2014, 144, w14037. [Google Scholar] [CrossRef] [PubMed]
- Fedorova, M.; Bollineni, R.C.; Hoffmann, R. Protein carbonylation as a major hallmark of oxidative damage: Update of analytical strategies. Mass Spectrom. Rev. 2014, 33, 79–97. [Google Scholar] [CrossRef]
- Cristani, M.; Speciale, A.; Saija, A.; Gangemi, S.; Minciullo, P.L.; Cimino, F. Circulating Advanced Oxidation Protein Products as Oxidative Stress Biomarkers and Progression Mediators in Pathological Conditions Related to Inflammation and Immune Dysregulation. Curr. Med. Chem. 2016, 23, 3862–3882. [Google Scholar] [CrossRef]
- Bizzozero, O.A. Protein Carbonylation in Neurodegenerative and Demyelinating CNS Diseases. In Handbook of Neurochemistry and Molecular Neurobiology: Brain and Spinal Cord Trauma; Lajtha, A., Banik, N., Ray, S.K., Eds.; Springer US: Boston, MA, USA, 2009; pp. 543–562. [Google Scholar]
- Ipson, B.R.; Fisher, A.L. Roles of the tyrosine isomers meta-tyrosine and ortho-tyrosine in oxidative stress. Ageing Res. Rev. 2016, 27, 93–107. [Google Scholar] [CrossRef] [Green Version]
- Møller, I.M.; Rogowska-Wrzesinska, A.; Rao, R.S.P. Protein carbonylation and metal-catalyzed protein oxidation in a cellular perspective. J. Proteom. 2011, 74, 2228–2242. [Google Scholar] [CrossRef]
- Pradeep, A.R.; Ramchandraprasad, M.V.; Bajaj, P.; Rao, N.S.; Agarwal, E. Protein carbonyl: An oxidative stress marker in gingival crevicular fluid in healthy, gingivitis, and chronic periodontitis subjects. Contemp. Clin. Dent. 2013, 4, 27–31. [Google Scholar] [CrossRef] [PubMed]
- Adams, L.; Franco, M.C.; Estevez, A.G. Reactive nitrogen species in cellular signaling. Exp. Biol. Med. 2015, 240, 711–717. [Google Scholar] [CrossRef] [PubMed] [Green Version]
- Lubos, E.; Handy, D.E.; Loscalzo, J. Role of oxidative stress and nitric oxide in atherothrombosis. Front. Biosci. 2008, 13, 5323–5344. [Google Scholar] [CrossRef] [PubMed] [Green Version]
- Annie-Jeyachristy, S.; Geetha, A.; Surendran, R.; Sundaram, A.; Lavanya, K.; Kumar, S.J.; Prakash, S.A. Level of nitrated proteins in the plasma, platelets and liver of patients with liver cirrhosis. Redox Rep. 2009, 14, 259–266. [Google Scholar] [CrossRef]
- Wayenberg, J.L.; Ransy, V.; Vermeylen, D.; Damis, E.; Bottari, S.P. Nitrated plasma albumin as a marker of nitrative stress and neonatal encephalopathy in perinatal asphyxia. Free Radic. Biol. Med. 2009, 47, 975–982. [Google Scholar] [CrossRef]
- Poetsch, A.R. The genomics of oxidative DNA damage, repair, and resulting mutagenesis. Comp. Struct. Biol. J. 2020, 18, 207–219. [Google Scholar] [CrossRef] [PubMed]
- Kong, Q.; Lin, C.L. Oxidative damage to RNA: Mechanisms, consequences, and diseases. Cell. Mol. Life Sci. 2010, 67, 1817–1829. [Google Scholar] [CrossRef] [Green Version]
- Ichikawa, J.; Tsuchimoto, D.; Oka, S.; Ohno, M.; Furuichi, M.; Sakumi, K.; Nakabeppu, Y. Oxidation of mitochondrial deoxynucleotide pools by exposure to sodium nitroprusside induces cell death. DNA Repair. 2008, 7, 418–430. [Google Scholar] [CrossRef]
- Sharma, P.; Jha, A.B.; Dubey, R.S.; Pessarakli, M. Reactive oxygen species, oxidative damage, and antioxidative defense mechanism in plants under stressful conditions. J. Bot. 2012, 2012, 217037. [Google Scholar] [CrossRef] [Green Version]
- Kasai, H.; Kawai, K.; Li, Y. Analysis of 8-OH-dG and 8-OH-gua as biomarkers of oxidative stress. Genes Environ. 2008, 30, 33–40. [Google Scholar] [CrossRef] [Green Version]
- Cadet, J.; Delatour, T.; Douki, T.; Gasparutto, D.; Pouget, J.-P.; Ravanat, J.-L.; Sauvaigo, S. Hydroxyl radicals and DNA base damage. Mut. Res. 1999, 424, 9–21. [Google Scholar] [CrossRef]
- Hu, R.; Saw, C.L.-L.; Yu, R.; Kong, A.-N.T. Regulation of NF-E2-related factor 2 signaling for cancer chemoprevention: Antioxidant Coupled with antiinflammatory. Antiox. Redox Signal. 2010, 13, 1679–1698. [Google Scholar] [CrossRef] [Green Version]
- Marrocco, I.; Altieri, F.; Peluso, I. Measurement and Clinical Significance of Biomarkers of Oxidative Stress in Humans. Oxid. Med. Cell. Longev. 2017, 2017, 6501046. [Google Scholar] [CrossRef]
- Ma, Q. Role of nrf2 in oxidative stress and toxicity. Annu. Rev. Pharmacol. Toxicol. 2013, 53, 401–426. [Google Scholar] [CrossRef] [Green Version]
- Cornejo, P.; Vargas, R.; Videla, L.A. Nrf2-regulated phase-II detoxification enzymes and phase-III transporters are induced by thyroid hormone in rat liver. Biofactors 2013, 39, 514–521. [Google Scholar] [CrossRef]
- Liu, X.-F.; Zhou, D.-D.; Xie, T.; Malik, T.H.; Lu, C.-B.; Li, H.-J.; Wang, F.; Shu, C.; Liu, C.; Lu, C.-W.; et al. Nrf2, a Potential Therapeutic Target against Oxidative Stress in Corneal Diseases. Oxid. Med. Cell. Longev. 2017, 2017, 2326178. [Google Scholar] [CrossRef] [Green Version]
- Ahmed, S.M.; Luo, L.; Namani, A.; Wang, X.J.; Tang, X. Nrf2 signaling pathway: Pivotal roles in inflammation. Biochim. Biophys. Acta Mol. Basis. Dis. 2017, 1863, 585–597. [Google Scholar] [CrossRef] [PubMed]
- Jyrkkänen, H.K.; Kansanen, E.; Inkala, M.; Kivelä, A.M.; Hurttila, H.; Heinonen, S.E.; Goldsteins, G.; Jauhiainen, S.; Tiainen, S.; Makkonen, H.; et al. Nrf2 regulates antioxidant gene expression evoked by oxidized phospholipids in endothelial cells and murine arteries in vivo. Circ. Res. 2008, 103, e1–e9. [Google Scholar] [CrossRef] [Green Version]
- Bischoff, L.J.M.; Kuijper, I.A.; Schimming, J.P.; Wolters, L.; Braak, B.; Langenberg, J.P.; Noort, D.; Beltman, J.B.; van de Water, B. A systematic analysis of Nrf2 pathway activation dynamics during repeated xenobiotic exposure. Arch. Toxicol. 2019, 93, 435–451. [Google Scholar] [CrossRef] [PubMed] [Green Version]
- Fukai, T.; Ushio-Fukai, M. Superoxide dismutases: Role in redox signaling, vascular function, and diseases. Antioxid. Redox. Signal. 2011, 15, 1583–1606. [Google Scholar] [CrossRef] [Green Version]
- Goyal, M.; Basak, A. Human catalase: Looking for complete identity. Protein Cell 2010, 1, 888–897. [Google Scholar] [CrossRef] [PubMed] [Green Version]
- Quan, W.; Huang, Y.; Zhang, X.; Weng, Y.; Li, Y. Serum antioxidant status of bilirubin, albumin, uric acid, and creatinine in patients with meningitis. Int. J. Clin. Exp. Med. 2020, 13, 857–865. [Google Scholar]
- Zitka, O.; Skalickova, S.; Gumulec, J.; Masarik, M.; Adam, V.; Hubalek, J.; Trnkova, L.; Kruseova, J.; Eckschlager, T.; Kizek, R. Redox status expressed as GSH:GSSG ratio as a marker for oxidative stress in paediatric tumour patients. Oncol. Lett. 2012, 4, 1247–1253. [Google Scholar] [CrossRef] [Green Version]
- Pizzorno, J. Glutathione! Integr. Med. 2014, 13, 8–12. [Google Scholar]
- Ithayaraja, C.M. Mini-review: Metabolic functions and molecular structure of glutathione reductase. Int. J. Pharm Sci. Rev. Res. 2011, 9, 104–115. [Google Scholar]
- Ihara, H.; Hashizume, N.; Hasegawa, T.; Yoshida, M. Antioxidant capacities of ascorbic acid, uric acid, alpha-tocopherol, and bilirubin can be measured in the presence of another antioxidant, serum albumin. J. Clin. Lab. Anal. 2004, 18, 45–49. [Google Scholar] [CrossRef]
- Wang, Y.; Chun, O.K.; Song, W.O. Plasma and Dietary Antioxidant Status as Cardiovascular Disease Risk Factors: A Review of Human Studies. Nutrients 2013, 5, 2969–3004. [Google Scholar] [CrossRef] [Green Version]
- Wrieden, W.L.; Hannah, M.K.; Bolton-Smith, C.; Tavendale, R.; Morrison, C.; Tunstall-Pedoe, H. Plasma vitamin C and food choice in the third Glasgow MONICA population survey. J. Epidemiol. Commun. Health 2000, 54, 355–360. [Google Scholar] [CrossRef] [PubMed]
- Waniek, S.; di Giuseppe, R.; Esatbeyoglu, T.; Plachta-Danielzik, S.; Ratjen, I.; Jacobs, G.; Nöthlings, U.; Koch, M.; Schlesinger, S.; Rimbach, G.; et al. Vitamin E (α- and γ-Tocopherol) Levels in the Community: Distribution, Clinical and Biochemical Correlates, and Association with Dietary Patterns. Nutrients 2017, 10, 3. [Google Scholar] [CrossRef] [Green Version]
- Böhm, V.; Borel, P.; Corte-Real, J.; de Lera, A.; Desmarchelier, C.; Dulinska-Litewka, J.; Landrier, J.-F.; Lietz, G.; Milisav, I.; Nolan, J.; et al. From carotenoid intake to carotenoid blood and tissue concentrations—Implications for dietary intake recommendations. Nutr. Rev. 2019. In Press. [Google Scholar] [CrossRef]
- Murphy, N.; Achaintre, D.; Zamora-Ros, R.; Jenab, M.; Boutron-Ruault, M.-C.; Carbonnel, F.; Savoye, I.; Kaaks, R.; Kühn, T.; Boeing, H.; et al. A prospective evaluation of plasma polyphenol levels and colon cancer risk. Int. J. Cancer 2018, 143, 1620–1631. [Google Scholar] [CrossRef] [PubMed]
- Nicholson, L.B. The immune system. Essays Biochem. 2016, 60, 275–301. [Google Scholar] [CrossRef] [PubMed] [Green Version]
- Rosales, C. Neutrophil: A Cell with Many Roles in Inflammation or Several Cell Types? Front. Physiol. 2018, 9, 113. [Google Scholar] [CrossRef] [PubMed]
- Kim, K.I.; Lee, J.; Heo, N.J.; Kim, S.; Chin, H.J.; Na, K.Y.; Chae, D.W.; Kim, C.H.; Kim, S. Differential white blood cell count and all-cause mortality in the Korean elderly. Exp. Gerontol. 2013, 48, 103–108. [Google Scholar] [CrossRef]
- Rothenberg, M.E.; Hogan, S.P. The eosinophil. Annu. Rev. Immunol. 2006, 24, 147–174. [Google Scholar] [CrossRef] [PubMed]
- Davoine, F.; Cao, M.; Wu, Y.; Ajamian, F.; Ilarraza, R.; Kokaji, A.I.; Moqbel, R.; Adamko, D.J. Virus-induced eosinophil mediator release requires antigen-presenting and CD4+ T cells. J. Allergy Clin. Immunol. 2008, 122, 69–77.e2. [Google Scholar] [CrossRef]
- Yousefi, S.; Gold, J.A.; Andina, N.; Lee, J.J.; Kelly, A.M.; Kozlowski, E.; Schmid, I.; Straumann, A.; Reichenbach, J.; Gleich, G.J.; et al. Catapult-like release of mitochondrial DNA by eosinophils contributes to antibacterial defense. Nat. Med. 2008, 14, 949–953. [Google Scholar] [CrossRef]
- Nakashima, C.; Otsuka, A.; Kabashima, K. Recent advancement in the mechanism of basophil activation. J. Dermatol. Sci. 2018, 91, 3–8. [Google Scholar] [CrossRef] [PubMed] [Green Version]
- Mosser, D.M.; Edwards, J.P. Exploring the full spectrum of macrophage activation. Nat. Rev. Immunol. 2008, 8, 958–969. [Google Scholar] [CrossRef]
- Li, C.; Wu, X.; Liu, S.; Shen, D.; Zhu, J.; Liu, K. Role of Resolvins in the Inflammatory Resolution of Neurological Diseases. Front. Pharmacol. 2020, 11, 612. [Google Scholar] [CrossRef]
- Serhan, C.N.; Levy, B.D. Resolvins in inflammation: Emergence of the pro-resolving superfamily of mediators. J. Clin. Investig. 2018, 128, 2657–2669. [Google Scholar] [CrossRef]
- Calder, P.C. Omega-3 polyunsaturated fatty acids and inflammatory processes: Nutrition or pharmacology? Br. J. Clin. Pharmacol. 2013, 75, 645–662. [Google Scholar] [CrossRef] [PubMed] [Green Version]
- Chattopadhyay, R.; Mani, A.M.; Singh, N.K.; Rao, G.N. Resolvin D1 blocks H(2)O(2)-mediated inhibitory crosstalk between SHP2 and PP2A and suppresses endothelial-monocyte interactions. Free Radic. Biol. Med. 2018, 117, 119–131. [Google Scholar] [CrossRef] [PubMed]
- Sobolewski, C.; Cerella, C.; Dicato, M.; Ghibelli, L.; Diederich, M. The Role of Cyclooxygenase-2 in Cell Proliferation and Cell Death in Human Malignancies. Int. J. Cell. Biol. 2010, 2010, 215158. [Google Scholar] [CrossRef] [Green Version]
- Ricciotti, E.; FitzGerald, G.A. Prostaglandins and inflammation. Arterioscler. Thromb. Vasc. Biol. 2011, 31, 986–1000. [Google Scholar] [CrossRef] [PubMed]
- Tsuge, K.; Inazumi, T.; Shimamoto, A.; Sugimoto, Y. Molecular mechanisms underlying prostaglandin E2-exacerbated inflammation and immune diseases. Int. Immunol. 2019, 31, 597–606. [Google Scholar] [CrossRef] [PubMed]
- Chaplin, D.D. Overview of the immune response. J. Allergy Clin. Immunol. 2010, 125, S3–S23. [Google Scholar] [CrossRef]
- Pandya, P.H.; Murray, M.E.; Pollok, K.E.; Renbarger, J.L. The immune system in cancer pathogenesis: Potential therapeutic approaches. J. Immunol. Res. 2016, 2016, 4273943. [Google Scholar] [CrossRef]
- Janeway, C.A., Jr.; Travers, P.; Walport, M.; Shlomchik, M.J. Principles of innate and adaptive immunity. In Immunobiology: The Immune System in Health and Disease, 5th ed.; Garland Science: New York, NY, USA, 2001. [Google Scholar]
- Perez, L. Acute phase protein response to viral infection and vaccination. Arch. Biochem. Biophys. 2019, 671, 196–202. [Google Scholar] [CrossRef]
- Dinarello, C.A. Historical insights into cytokines. Eur. J. Immunol. 2007, 37 (Suppl. 1), S34–S45. [Google Scholar] [CrossRef] [PubMed] [Green Version]
- Ott, L.W.; Resing, K.A.; Sizemore, A.W.; Heyen, J.W.; Cocklin, R.R.; Pedrick, N.M.; Woods, H.C.; Chen, J.Y.; Goebl, M.G.; Witzmann, F.A.; et al. Tumor Necrosis Factor-alpha- and interleukin-1-induced cellular responses: Coupling proteomic and genomic information. J. Proteome Res. 2007, 6, 2176–2185. [Google Scholar] [CrossRef] [Green Version]
- Kany, S.; Vollrath, J.T.; Relja, B. Cytokines in Inflammatory Disease. Int. J. Mol. Sci. 2019, 20, 6008. [Google Scholar] [CrossRef] [PubMed] [Green Version]
- Gruys, E.; Toussaint, M.J.M.; Niewold, T.A.; Koopmans, S.J. Acute phase reaction and acute phase proteins. J. Zheijang Univ. 2005, 6, 1045–1056. [Google Scholar] [CrossRef] [PubMed] [Green Version]
- Fleetwood, A.J.; Cook, A.D.; Hamilton, J.A. Functions of granulocyte-macrophage colony-stimulating factor. Crit. Rev. Immunol. 2005, 25, 405–428. [Google Scholar] [CrossRef]
- Tilg, H.; Peschel, C. Interferon-alpha and its effects on the cytokine cascade: A pro- and anti-inflammatory cytokine. Leuk. Lymphoma 1996, 23, 55–60. [Google Scholar] [CrossRef]
- van Miert, A.S. Pro-inflammatory cytokines in a ruminant model: Pathophysiological, pharmacological, and therapeutic aspects. Vet. Q 1995, 17, 41–50. [Google Scholar] [CrossRef] [PubMed]
- Tanaka, T.; Narazaki, M.; Kishimoto, T. IL-6 in inflammation, immunity, and disease. Cold Spring Harb. Perspect Biol. 2014, 6, a016295. [Google Scholar] [CrossRef]
- Scheller, J.; Chalaris, A.; Schmidt-Arras, D.; Rose-John, S. The pro- and anti-inflammatory properties of the cytokine interleukin-6. Biochim. Biophys. Acta 2011, 1813, 878–888. [Google Scholar] [CrossRef] [Green Version]
- Fuster, J.J.; Walsh, K. The good, the bad, and the ugly of interleukin-6 signaling. EMBO J. 2014, 33, 1425–1427. [Google Scholar] [CrossRef] [Green Version]
- Qazi, B.S.; Tang, K.; Qazi, A. Recent advances in underlying pathologies provide insight into interleukin-8 expression-mediated inflammation and angiogenesis. Int. J. Inflam. 2011, 2011, 908468. [Google Scholar] [CrossRef] [Green Version]
- David, J.M.; Dominguez, C.; Hamilton, D.H.; Palena, C. The IL-8/IL-8R Axis: A Double Agent in Tumor Immune Resistance. Vaccines 2016, 4, 22. [Google Scholar] [CrossRef] [Green Version]
- Granger, D.N.; Senchenkova, E. Inflammation and the Microcirculation; Morgan & Claypool Life Sciences: San Rafael, CA, USA, 2010. Available online: https://www.ncbi.nlm.nih.gov/books/NBK53373/ (accessed on 20 November 2020).
- Sedger, L.M.; McDermott, M.F. TNF and TNF-receptors: From mediators of cell death and inflammation to therapeutic giants-past, present and future. Cytokine Growth Factor Rev. 2014, 25, 453–472. [Google Scholar] [CrossRef] [Green Version]
- Chu, W.M. Tumor necrosis factor. Cancer Lett. 2013, 328, 222–225. [Google Scholar] [CrossRef] [PubMed] [Green Version]
- Janeway, C.A., Jr.; Travers, P.; Walport, M. The major histocompatibility complex and its functions. In Immunobiology: The Immune System in Health and Disease, 5th ed.; Garland Science: New York, NY, USA, 2001. Available online: https://www.ncbi.nlm.nih.gov/books/NBK27156/ (accessed on 20 November 2020).
- Lin, F.; Young, H. The talented interferon-gamma. Adv. Biosci. Biotechnol. 2013, 4, 6–13. [Google Scholar] [CrossRef] [Green Version]
- Knolle, P.; Löhr, H.; Treichel, U.; Dienes, H.P.; Lohse, A.; Schlaack, J.; Gerken, G. Parenchymal and nonparenchymal liver cells and their interaction in the local immune response. Z Gastroenterol. 1995, 33, 613–620. [Google Scholar]
- Prasanna, J.; Sumadhura, C.; Karunakar, P. Neopterin as a diagnostic biomarker for diagnosis of inflammatory diseases like periodontitis. J. Oral Res. Rev. 2017, 9, 45–49. [Google Scholar] [CrossRef]
- Haupt, W.; Hohenberger, W.; Klein, P.; Christou, N.V. Detection of neopterin, interleukin-6 and acute-phase proteins as parameters of potential monocyte activation in preoperative patients. Infection 1995, 23, 263–266. [Google Scholar] [CrossRef]
- Melichar, B.; Spisarová, M.; Bartoušková, M.; Krčmová, L.K.; Javorská, L.; Študentová, H. Neopterin as a biomarker of immune response in cancer patients. Ann. Transl Med. 2017, 5, 280. [Google Scholar] [CrossRef] [PubMed] [Green Version]
- Blackburn, W.D., Jr. Validity of acute phase proteins as markers of disease activity. J. Rheumatol. Suppl. 1994, 42, 9–13. [Google Scholar] [PubMed]
- Fratelli, M.; Zinetti, M.; Fantuzzi, G.; Spina, C.; Napoletano, G.; Donatiello, G.; Ravagnan, R.; Sipe, J.D.; Casey, C.A.; Ghezzi, P. Time course of circulating acute phase proteins and cytokines in septic patients. Amyloid 1997, 4, 33–39. [Google Scholar] [CrossRef]
- Chen, L.; Deng, H.; Cui, H.; Fang, J.; Zuo, Z.; Deng, J.; Li, Y.; Wang, X.; Zhao, L. Inflammatory responses and inflammation-associated diseases in organs. Oncotarget 2018, 9, 7204–7218. [Google Scholar] [CrossRef] [Green Version]
- Heinrich, P.C.; Castell, J.V.; Andus, T. Interleukin-6 and the acute phase response. Biochem. J. 1990, 265, 621–636. [Google Scholar] [CrossRef]
- Jain, S.; Gautam, V.; Naseem, S. Acute-phase proteins: As diagnostic tool. J. Pharm. Bioallied. Sci. 2011, 3, 118–127. [Google Scholar] [CrossRef]
- Salazar, J.; Martinez Cruz, M.; Chávez, M.; Nuñez, V.; Añez, R.; Torres, Y.; Toledo, A.; Chacín, M.; Silva, C.; Pacheco, E.; et al. C-reactive protein: An in-depth look into structure, function, and regulation. Int. Schol. Res. Not. 2014, 2014, 1–11. [Google Scholar] [CrossRef] [Green Version]
- Sack, G.H., Jr. Serum amyloid A—A review. Mol. Med. 2018, 24, 46. [Google Scholar] [CrossRef] [PubMed]
- Han, C.Y.; Tang, C.; Guevara, M.E.; Wei, H.; Wietecha, T.; Shao, B.; Subramanian, S.; Omer, M.; Wang, S.; O’Brien, K.D.; et al. Serum amyloid A impairs the antiinflammatory properties of HDL. J. Clin. Investig. 2016, 126, 266–281. [Google Scholar] [CrossRef] [PubMed] [Green Version]
- Thomsen, J.H.; Etzerodt, A.; Svendsen, P.; Moestrup, S.K. The haptoglobin-CD163-heme oxygenase-1 pathway for hemoglobin scavenging. Oxid. Med. Cell. Longev. 2013, 2013, 523652. [Google Scholar] [CrossRef] [PubMed] [Green Version]
- Takahashi, K.; Ip, W.E.; Michelow, I.C.; Ezekowitz, R.A. The mannose-binding lectin: A prototypic pattern recognition molecule. Curr. Opin. Immunol. 2006, 18, 16–23. [Google Scholar] [CrossRef]
- Takahashi, K. Mannose-binding lectin and the balance between immune protection and complication. Expert Rev. Anti Infect. Ther. 2011, 9, 1179–1190. [Google Scholar] [CrossRef]
- Soeters, P.B.; Wolfe, R.R.; Shenkin, A. Hypoalbuminemia: Pathogenesis and clinical significance. J. Parent Ent. Nutr. 2019, 43, 181–193. [Google Scholar] [CrossRef] [PubMed] [Green Version]
- Bourdon, E.; Blache, D. The importance of proteins in defense against oxidation. Antioxid. Redox Signal. 2001, 3, 293–311. [Google Scholar] [CrossRef] [PubMed]
- Ng, T.B.; Wong, J.H. A review of serum albumin. J. Cell. Immunol. Ser. Biol. 2018, 4, 1–3. [Google Scholar]
- Sharma, M.; Khan, S.; Rahman, S.; Singh, L.R. The Extracellular Protein, Transthyretin Is an Oxidative Stress Biomarker. Front. Physiol. 2019, 10, 5. [Google Scholar] [CrossRef] [PubMed]
- Wessling-Resnick, M. Iron homeostasis and the inflammatory response. Annu. Rev. Nutr. 2010, 30, 105–122. [Google Scholar] [CrossRef] [Green Version]
- Pfeiffer, C.M.; Looker, A.C. Laboratory methodologies for indicators of iron status: Strengths, limitations, and analytical challenges. Am. J. Clin. Nutr. 2017, 106, 1606s–1614s. [Google Scholar] [CrossRef] [Green Version]
- Fortunato, A. A new sensitive automated assay for procalcitonin detection: LIAISON(®) BRAHMS PCT(®) II GEN. Pract. Lab. Med. 2016, 6, 1–7. [Google Scholar] [CrossRef] [Green Version]
- Becker, K.L.; Snider, R.; Nylen, E.S. Procalcitonin in sepsis and systemic inflammation: A harmful biomarker and a therapeutic target. Br. J. Pharmacol. 2010, 159, 253–264. [Google Scholar] [CrossRef]
- Hayden, M.S.; Ghosh, S. NF-κB in immunobiology. Cell Res. 2011, 21, 223–244. [Google Scholar] [CrossRef] [Green Version]
- Oeckinghaus, A.; Ghosh, S. The NF-kappaB family of transcription factors and its regulation. Cold Spring Harb. Perspect Biol. 2009, 1, a000034. [Google Scholar] [CrossRef] [PubMed]
- Lingappan, K. NF-κB in Oxidative Stress. Curr. Opin. Toxicol. 2018, 7, 81–86. [Google Scholar] [CrossRef]
- Dong, J.; Qu, Y.; Li, J.; Cui, L.; Wang, Y.; Lin, J.; Wang, H. Cortisol inhibits NF-κB and MAPK pathways in LPS activated bovine endometrial epithelial cells. Int. Immunopharmacol. 2018, 56, 71–77. [Google Scholar] [CrossRef]
- Kaulmann, A.; Bohn, T. Carotenoids, inflammation, and oxidative stress—Implications of cellular signaling pathways and relation to chronic disease prevention. Nutr. Res. 2014, 34, 907–929. [Google Scholar] [CrossRef] [PubMed]
- Ruland, J. Return to homeostasis: Downregulation of NF-κB responses. Nat. Immunol. 2011, 12, 709–714. [Google Scholar] [CrossRef] [PubMed]
- Hayden, M.S.; West, A.P.; Ghosh, S. NF-κB and the immune response. Oncogene 2006, 25, 6758–6780. [Google Scholar] [CrossRef] [PubMed] [Green Version]
- Lawrence, T. The nuclear factor NF-kappaB pathway in inflammation. Cold Spring Harb. Perspect Biol. 2009, 1, a001651. [Google Scholar] [CrossRef] [Green Version]
- Grivennikov, S.I.; Karin, M. Dangerous liaisons: STAT3 and NF-kappaB collaboration and crosstalk in cancer. Cytokine Growth Factor Rev. 2010, 21, 11–19. [Google Scholar] [CrossRef] [Green Version]
- Yasuda, K.; Takeuchi, Y.; Hirota, K. The pathogenicity of Th17 cells in autoimmune diseases. Semin. Immunopathol. 2019, 41, 283–297. [Google Scholar] [CrossRef]
- Nast, R.; Staab, J.; Meyer, T. Gene activation by the cytokine-driven transcription factor STAT1. In Gene Regulation; Behzadi, P., Ed.; Intech Open: London, UK, 2019. [Google Scholar]
- Ferrari, R.S.; Andrade, C.F. Oxidative Stress and Lung Ischemia-Reperfusion Injury. Oxid. Med. Cell. Longev. 2015, 2015, 590987. [Google Scholar] [CrossRef] [PubMed]
- Guan, L.Y.; Fu, P.Y.; Li, P.D.; Li, Z.N.; Liu, H.Y.; Xin, M.G.; Li, W. Mechanisms of hepatic ischemia-reperfusion injury and protective effects of nitric oxide. World J. Gastrointest. Surg. 2014, 6, 122–128. [Google Scholar] [CrossRef]
- Rohrbach, S.; Troidl, C.; Hamm, C.; Schulz, R. Ischemia and reperfusion related myocardial inflammation: A network of cells and mediators targeting the cardiomyocyte. IUBMB Life 2015, 67, 110–119. [Google Scholar] [CrossRef] [Green Version]
- Malek, M.; Nematbakhsh, M. Renal ischemia/reperfusion injury; from pathophysiology to treatment. J. Renal. Inj. Prev. 2015, 4, 20–27. [Google Scholar] [PubMed]
- Ham, P.B.; Raju, R. Mitochondrial function in hypoxic ischemic injury and influence of aging. Prog. Neurobiol. 2017, 157, 92–116. [Google Scholar] [CrossRef] [PubMed]
- Labat-Robert, J.; Robert, L. Longevity and aging. Role of free radicals and xanthine oxidase. A review. Pathol. Biol. 2014, 62, 61–66. [Google Scholar] [CrossRef]
- EFSA. Guidance on the scientific requirements for health claims related to antioxidants, oxidative damage and cardiovascular health. EFSA J. 2018, 16, 5136. [Google Scholar]
- Boas, J.F.; Drew, S.C.; Curtain, C.C. Applications of electron paramagnetic resonance to studies of neurological disease. Eur. Biophys. J. 2008, 37, 281–294. [Google Scholar] [CrossRef]
- Mrakic-Sposta, S.; Gussoni, M.; Montorsi, M.; Porcelli, S.; Vezzoli, A. A quantitative method to monitor reactive oxygen species production by electron paramagnetic resonance in physiological and pathological conditions. Oxid. Med. Cell. Longev. 2014, 2014, 306179. [Google Scholar] [CrossRef] [Green Version]
- Qing, X.; Shi, D.; Lv, X.; Wang, B.; Chen, S.; Shao, Z. Prognostic significance of 8-hydroxy-2′-deoxyguanosine in solid tumors: A meta-analysis. BMC Cancer 2019, 19, 997. [Google Scholar] [CrossRef] [Green Version]
- Hoffmann, H.; Högel, J.; Speit, G. The effect of smoking on DNA effects in the comet assay: A meta-analysis. Mutagenesis 2005, 20, 455–466. [Google Scholar] [CrossRef]
- Tryfidou, D.V.; McClean, C.; Nikolaidis, M.G.; Davison, G.W. DNA Damage Following Acute Aerobic Exercise: A Systematic Review and Meta-analysis. Sports Med. 2020, 50, 103–127. [Google Scholar] [CrossRef] [PubMed] [Green Version]
- Kumar, A.; Dhillon, B.S.; Rao, D.N.; Menon, G.; Shankar, H.; Dhaliwal, L.K.; Leema, M.; Chandhiok, N.; Kumar, N.; Sehgal, R.; et al. Temporal trends of malondialdehyde in stored human plasma. Indian J. Clin. Biochem. 2012, 27, 405–409. [Google Scholar] [CrossRef] [PubMed]
- Pinna, A.; Boscia, F.; Paliogiannis, P.; Carru, C.; Zinellu, A. Malondialdehyde levels in patients with age-related macular degeneration: A Systematic review and meta-analysis. Retina 2020, 40, 195–203. [Google Scholar] [CrossRef]
- Paliogiannis, P.; Fois, A.G.; Sotgia, S.; Mangoni, A.A.; Zinellu, E.; Pirina, P.; Carru, C.; Zinellu, A. Circulating malondialdehyde concentrations in patients with stable chronic obstructive pulmonary disease: A systematic review and meta-analysis. Biomark. Med. 2018, 12, 771–781. [Google Scholar] [CrossRef]
- Balbi, M.; Stumpf Tonin, F.; Mendes, A.; Borba, H.; Wiens, A.; Fernandez-Llimos, F.; Pontarolo, R. Antioxidant effects of vitamins in type 2 diabetes: A meta-analysis of randomized controlled trials. Diabetol. Metab. Syndr. 2018, 10, 1–12. [Google Scholar] [CrossRef] [Green Version]
- Chehne, F.; Oguogho, A.; Lupattelli, G.; Budinsky, A.C.; Palumbo, B.; Sinzinger, H. Increase of isoprostane 8-epi-PGF(2alpha)after restarting smoking. Prostaglandins Leukot. Essent Fatty. Acids 2001, 64, 307–310. [Google Scholar] [CrossRef]
- Kitano, S.; Hisatomi, H.; Hibi, N.; Kawano, K.; Harada, S. Improved method of plasma 8-Isoprostane measurement and association analyses with habitual drinking and smoking. World J. Gastroenterol. 2006, 12, 5846–5852. [Google Scholar] [CrossRef] [PubMed]
- Yan, W.; Byrd, G.D.; Ogden, M.W. Quantitation of isoprostane isomers in human urine from smokers and nonsmokers by LC-MS/MS. J. Lipid Res. 2007, 48, 1607–1617. [Google Scholar] [CrossRef] [Green Version]
- van’t Erve, T.J.; Kadiiska, M.B.; London, S.J.; Mason, R.P. Classifying oxidative stress by F2-isoprostane levels across human diseases: A meta-analysis. Redox Biol. 2017, 12, 582–599. [Google Scholar] [CrossRef] [PubMed]
- Karlis, G.; Kotanidou, A.; Georgiopoulos, G.; Masi, S.; Magkas, N.; Xanthos, T. Usefulness of F2-isoprostanes in early prognostication after cardiac arrest: A topical review of the literature and meta-analysis of preclinical data. Biomarkers 2020, 25, 315–321. [Google Scholar] [CrossRef] [PubMed]
- Huang, Z.-W.; Ouyang, W.; Zhang, L.-J.; Li, H.; Ye, Y.-M.; Lin, X.-J.; Xu, Q.-Z.; Lin, L.; Chen, L.-D. Association of continuous positive airway pressure with F2-isoprostanes in adults with obstructive sleep apnea: A meta-analysis. Sleep Breath 2019, 23, 1115–1122. [Google Scholar] [CrossRef]
- Black, C.; Bot, M.; Scheffer, P.; Cuijpers, P.; Penninx, B.W. Is depression associated with increased oxidative stress? A systematic review and meta-analysis. Psychoneuroendocrinology 2015, 51, 164–175. [Google Scholar] [CrossRef] [PubMed] [Green Version]
- Adachi, J.; Matsushita, S.; Yoshioka, N.; Funae, R.; Fujita, T.; Higuchi, S.; Ueno, Y. Plasma phosphatidylcholine hydroperoxide as a new marker of oxidative stress in alcoholic patients. J. Lipid Res. 2004, 45, 967–971. [Google Scholar] [CrossRef] [Green Version]
- Miyazawa, T.; Suzuki, T.; Fujimoto, K.; Kinoshita, M. Age-related change of phosphatidylcholine hydroperoxide and phosphatidylethanolamine hydroperoxide levels in normal human red blood cells. Mech. Ageing Dev. 1996, 86, 145–150. [Google Scholar] [CrossRef]
- Sanaka, T.; Takahashi, C.; Sanaka, M.; Higuchi, C.; Shinobe, M.; Hayasaka, Y.; Miyazawa, T.; Ishikawa, S.; Nihei, H.; Omori, Y. Accumulation of phosphatydilcholine-hydroperoxide in dialysis patients with diabetic nephropathy. Clin. Nephrol. 1995, 44 (Suppl. 1), S33–S37. [Google Scholar]
- Wu, T.; Willett, W.C.; Rifai, N.; Shai, I.; Manson, J.E.; Rimm, E.B. Is Plasma Oxidized Low-Density Lipoprotein, Measured With the Widely Used Antibody 4E6, an Independent Predictor of Coronary Heart Disease Among, U.S. Men and Women? J. Am. Coll. Cardiol. 2006, 48, 973–979. [Google Scholar] [CrossRef] [Green Version]
- Itabe, H.; Ueda, M. Measurement of plasma oxidized low-density lipoprotein and its clinical implications. J. Atheroscler. Thromb. 2007, 14, 1–11. [Google Scholar] [CrossRef] [Green Version]
- Fadaei, R.; Safari-Faramani, R.; Rezaei, M.; Ahmadi, R.; Rostampour, M.; Moradi, N.; Khazaie, H. Circulating levels of oxidized low-density lipoprotein in patients with obstructive sleep apnea: A systematic review and meta-analysis. Sleep Breath 2020, 24, 809–824. [Google Scholar] [CrossRef] [PubMed]
- Schwingshackl, L.; Krause, M.; Schmucker, C.; Hoffmann, G.; Rücker, G.; Meerpohl, J.J. Impact of different types of olive oil on cardiovascular risk factors: A systematic review and network meta-analysis. Nutr. Metab. Cardiovasc Dis. 2019, 29, 1030–1039. [Google Scholar] [CrossRef]
- Matteucci, E.; Biasci, E.; Giampietro, O. Advanced oxidation protein products in plasma: Stability during storage and correlation with other clinical characteristics. Acta Diabetol. 2001, 38, 187–189. [Google Scholar] [CrossRef]
- Skvarilová, M.; Bulava, A.; Stejskal, D.; Adamovská, S.; Bartek, J. Increased level of advanced oxidation products (AOPP) as a marker of oxidative stress in patients with acute coronary syndrome. Biomed. Pap. Med. Fac. Univ. Palacky Olomouc Czech. Repub. 2005, 149, 83–87. [Google Scholar] [CrossRef] [Green Version]
- Luceri, C.; Bigagli, E.; Agostiniani, S.; Giudici, F.; Zambonin, D.; Scaringi, S.; Ficari, F.; Lodovici, M.; Malentacchi, C. Analysis of oxidative stress-related markers in Crohn’s disease patients at surgery and correlations with clinical findings. Antioxidants 2019, 8, 378. [Google Scholar] [CrossRef] [PubMed] [Green Version]
- Conti, G.; Caccamo, D.; Siligato, R.; Gembillo, G.; Satta, E.; Pazzano, D.; Carucci, N.; Carella, A.; Campo, G.D.; Salvo, A.; et al. Association of Higher Advanced Oxidation Protein Products (AOPPs) Levels in Patients with Diabetic and Hypertensive Nephropathy. Medicina 2019, 55, 675. [Google Scholar] [CrossRef] [PubMed] [Green Version]
- Dayhoff-Brannigan, M.; Ferrucci, L.; Sun, K.; Fried, L.P.; Walston, J.; Varadhan, R.; Guralnik, J.M.; Semba, R.D. Oxidative protein damage is associated with elevated serum interleukin-6 levels among older moderately to severely disabled women living in the community. J. Gerontol. A Biol. Sci. Med. Sci. 2008, 63, 179–183. [Google Scholar] [CrossRef] [Green Version]
- Weber, D.; Davies, M.J.; Grune, T. Determination of protein carbonyls in plasma, cell extracts, tissue homogenates, isolated proteins: Focus on sample preparation and derivatization conditions. Redox Biol. 2015, 5, 367–380. [Google Scholar] [CrossRef] [PubMed] [Green Version]
- Sultana, R.; Perluigi, M.; Newman, S.F.; Pierce, W.M.; Cini, C.; Coccia, R.; Butterfield, D.A. Redox proteomic analysis of carbonylated brain proteins in mild cognitive impairment and early Alzheimer’s disease. Antioxid. Redox Signal. 2010, 12, 327–336. [Google Scholar] [CrossRef] [PubMed] [Green Version]
- Houjeghani, S.; Kheirouri, S.; Faraji, E.; Asghari Jafarabadi, M.; Jabbari, M. Antioxidant Status, Lipid Peroxidation and Protein Oxidation in Type 2 Diabetic Patients; Beneficial Effects of Supplementation with Carnosine: A Randomized, Double-Blind, Placebo-Controlled Trial. Iran. Red. Crescent Med. J. 2018, 20, e64116. [Google Scholar] [CrossRef]
- Kuo, L.J.; Yang, L.X. Gamma-H2AX—A novel biomarker for DNA double-strand breaks. In Vivo 2008, 22, 305–309. [Google Scholar]
- Palla, V.V.; Karaolanis, G.; Katafigiotis, I.; Anastasiou, I.; Patapis, P.; Dimitroulis, D.; Perrea, D. gamma-H2AX: Can it be established as a classical cancer prognostic factor? Tumour Biol. 2017, 39, 1010428317695931. [Google Scholar] [CrossRef] [Green Version]
- Bekeschus, S.; Schütz, C.S.; Nießner, F.; Wende, K.; Weltmann, K.D.; Gelbrich, N.; von Woedtke, T.; Schmidt, A.; Stope, M.B. Elevated H2AX Phosphorylation Observed with kINPen Plasma Treatment Is Not Caused by ROS-Mediated DNA Damage but Is the Consequence of Apoptosis. Oxid. Med. Cell. Longev. 2019, 2019, 8535163. [Google Scholar] [CrossRef] [Green Version]
- Abiaka, C.; Al-Awadi, F.; Olusi, S. Effect of Prolonged Storage on the Activities of Superoxide Dismutase, Glutathione Reductase, and Glutathione Peroxidase. Clin. Chem. 2000, 46, 566–567. [Google Scholar] [CrossRef] [Green Version]
- Flores-Mateo, G.; Carrillo-Santisteve, P.; Elosua, R.; Guallar, E.; Marrugat, J.; Bleys, J.; Covas, M.I. Antioxidant enzyme activity and coronary heart disease: Meta-analyses of observational studies. Am. J. Epidemiol. 2009, 170, 135–147. [Google Scholar] [CrossRef] [Green Version]
- Khan, Z.; Ali, S.A. Oxidative stress-related biomarkers in Parkinson’s disease: A systematic review and meta-analysis. Iran. J. Neurol. 2018, 17, 137–144. [Google Scholar] [CrossRef] [Green Version]
- Jayedi, A.; Rashidy-pour, A.; Parohan, M.; Zargar, M.; Shab Bidar, S. Dietary Antioxidants, Circulating Antioxidant Concentrations, Total Antioxidant Capacity, and Risk of All-Cause Mortality: A Systematic Review and Dose-Response Meta-Analysis of Prospective Observational Studies. Adv. Nutr. 2018, 9, 701–716. [Google Scholar] [CrossRef] [PubMed] [Green Version]
- Ruskovska, T.; Jansen, E.H.J.M.; Antarorov, R. Evaluation of assays for measurement of serum (anti)oxidants in hemodialysis patients. BioMed. Res. Int. 2014, 2014, 843157. [Google Scholar] [CrossRef]
- Pieme, C.A.; Tatangmo, J.A.; Simo, G.; Biapa Nya, P.C.; Ama Moor, V.J.; Moukette Moukette, B.; Tankeu Nzufo, F.; Njinkio Nono, B.L.; Sobngwi, E. Relationship between hyperglycemia, antioxidant capacity and some enzymatic and non-enzymatic antioxidants in African patients with type 2 diabetes. BMC Res. Notes 2017, 10, 141. [Google Scholar] [CrossRef] [PubMed] [Green Version]
- Biotech, R. User Manual Mouse NRF2 Transcription Factor Activity Assay. Available online: https://wwwraybiotechcom/mouse-nrf2-transcription-factor-activity-assay/ (accessed on 23 December 2020).
- Wang, L.; Zhang, C.; Qin, L.; Xu, J.; Li, X.; Wang, W.; Kong, L.; Zhou, T.; Li, X. The prognostic value of NRF2 in solid tumor patients: A meta-analysis. Oncotarget 2018, 9, 1257–1265. [Google Scholar] [CrossRef] [Green Version]
- Wang, Q.; Li, W.X.; Dai, S.X.; Guo, Y.C.; Han, F.F.; Zheng, J.J.; Li, G.H.; Huang, J.F. Meta-Analysis of Parkinson’s Disease and Alzheimer’s Disease Revealed Commonly Impaired Pathways and Dysregulation of NRF2-Dependent Genes. J. Alzheimers Dis. 2017, 56, 1525–1539. [Google Scholar] [CrossRef] [PubMed]
- Giustarini, D.; Galvagni, F.; Orlandini, M.; Fanti, P.; Rossi, R. Immediate stabilization of human blood for delayed quantification of endogenous thiols and disulfides. J. Chromatogr. B Analyt. Technol. Biomed. Life Sci. 2016, 1019, 51–58. [Google Scholar] [CrossRef] [Green Version]
- Bilir, B.; Akkoyun, D.; Aydin, M.; Gur, D.; Degirmenci, H.; Albayrak, N.; Akyuz, A.; Alpsoy, S.; Koca, C.; Erel, O. Association of coronary artery disease severity and disulphide/native thiol ratio. Eur. J. Gen. Med. 2017, 14, 30–33. [Google Scholar] [CrossRef]
- Oliveira, P.V.S.; Laurindo, F.R.M. Implications of plasma thiol redox in disease. Clin. Sci. 2018, 132, 1257–1280. [Google Scholar] [CrossRef]
- Elmas, B.; Karacan, M.; Dervişoğlu, P.; Kösecik, M.; İşgüven, Ş.P.; Bal, C. Dynamic thiol/disulphide homeostasis as a novel indicator of oxidative stress in obese children and its relationship with inflammatory-cardiovascular markers. Anatol. J. Cardiol. 2017, 18, 361–369. [Google Scholar] [CrossRef] [PubMed]
- Giustarini, D.; Tsikas, D.; Colombo, G.; Milzani, A.; Dalle-Donne, I.; Fanti, P.; Rossi, R. Pitfalls in the analysis of the physiological antioxidant glutathione (GSH) and its disulfide (GSSG) in biological samples: An elephant in the room. J. Chromatogr. B Analyt. Technol. Biomed. Life Sci. 2016, 1019, 21–28. [Google Scholar] [CrossRef] [PubMed] [Green Version]
- Rivas, A.; Romero, A.; Mariscal-Arcas, M.; Monteagudo, C.; López, G.; Lorenzo, M.L.; Ocaña-Peinado, F.M.; Olea-Serrano, F. Association between dietary antioxidant quality score (DAQs) and bone mineral density in Spanish women. Nutr. Hosp. 2012, 27, 1886–1893. [Google Scholar] [PubMed]
- Farhangi, M.A. Dietary total antioxidant capacity significantly interacts with 6-P21 rs2010963 gene polymorphisms in terms of cardio-metabolic risk factors in patients with metabolic syndrome. BMC Res. Notes 2020, 13, 145. [Google Scholar] [CrossRef] [PubMed]
- Wright, M.E.; Mayne, S.T.; Stolzenberg-Solomon, R.Z.; Li, Z.; Pietinen, P.; Taylor, P.R.; Virtamo, J.; Albanes, D. Development of a comprehensive dietary antioxidant index and application to lung cancer risk in a cohort of male smokers. Am. J. Epidemiol. 2004, 160, 68–76. [Google Scholar] [CrossRef] [PubMed] [Green Version]
- Suzen, S.; Gurer-Orhan, H.; Saso, L. Detection of Reactive Oxygen and Nitrogen Species by Electron Paramagnetic Resonance (EPR) Technique. Molecules 2017, 22, 181. [Google Scholar] [CrossRef] [PubMed]
- Nakagawa, K.; Kato, S.; Miyazawa, T. Determination of Phosphatidylcholine Hydroperoxide (PCOOH) as a Marker of Membrane Lipid Peroxidation. J. Nutr. Sci. Vitaminol. 2015, 61, S78–S80. [Google Scholar] [CrossRef] [PubMed]
- Yoshida, Y.; Umeno, A.; Shichiri, M. Lipid peroxidation biomarkers for evaluating oxidative stress and assessing antioxidant capacity in vivo. J. Clin. Biochem. Nutr. 2013, 52, 9–16. [Google Scholar] [CrossRef] [PubMed] [Green Version]
- Kuksis, A.; Pruzanski, W. Generation of phosphatidylcholine hydroperoxides and phosphatidylcholine isoprostanes during ultracentrifugation and storage of lipoproteins. Lipid Technol. 2014, 26, 11–14. [Google Scholar] [CrossRef]
- Hayashi, T.; Uchida, K.; Takebe, G.; Takahashi, K. Rapid formation of 4-hydroxy-2-nonenal, malondialdehyde, and phosphatidylcholine aldehyde from phospholipid hydroperoxide by hemoproteins. Free Radic. Biol. Med. 2004, 36, 1025–1033. [Google Scholar] [CrossRef] [PubMed]
- Nagashima, T.; Oikawa, S.; Hirayama, Y.; Tokita, Y.; Sekikawa, A.; Ishigaki, Y.; Yamada, R.; Miyazawa, T. Increase of serum phosphatidylcholine hydroperoxide dependent on glycemic control in type 2 diabetic patients. Diabetes Res. Clin. Pract. 2002, 56, 19–25. [Google Scholar] [CrossRef]
- Pyun, C.W.; Han, K.H.; Hong, G.E.; Lee, C.H. Effect of curcumin on the increase in hepatic or brain phosphatidylcholine hydroperoxide levels in mice after consumption of excessive alcohol. Biomed. Res. Int. 2013, 2013, 242671. [Google Scholar] [CrossRef] [Green Version]
- Al-Orf, S.M. Effect of oxidized phosphatidylcholine on biomarkers of oxidative stress in rats. Indian J. Clin. Biochem. 2011, 26, 154–160. [Google Scholar] [CrossRef] [PubMed] [Green Version]
- Gentile, F.; Arcaro, A.; Pizzimenti, S.; Daga, M.; Cetrangolo, G.P.; Dianzani, C.; Lepore, A.; Graf, M.; Ames, P.R.J.; Barrera, G. DNA damage by lipid peroxidation products: Implications in cancer, inflammation and autoimmunity. AIMS Genet. 2017, 4, 103–137. [Google Scholar] [CrossRef] [PubMed]
- Papastergiadis, A.; Mubiru, E.; Van Langenhove, H.; Meulenaer, B. Malondialdehyde measurement in oxidized foods: Evaluation of the spectrophotometric thiobarbituric acid reactive substances (TBARS) test in various foods. J. Agric. Food Chem. 2012, 60, 9589–9594. [Google Scholar] [CrossRef] [PubMed]
- Janero, D.R. Malondialdehyde and thiobarbituric acid-reactivity as diagnostic indices of lipid peroxidation and peroxidative tissue injury. Free Radical. Biol. Med. 1990, 9, 515–540. [Google Scholar] [CrossRef]
- Guichardant, M.; Bacot, S.; Molière, P.; Lagarde, M. Hydroxy-alkenals from the peroxidation of n-3 and n-6 fatty acids and urinary metabolites. Prostaglandins Leukot Essent Fatty Acids 2006, 75, 179–182. [Google Scholar] [CrossRef] [PubMed]
- Dalleau, S.; Baradat, M.; Guéraud, F.; Huc, L. Cell death and diseases related to oxidative stress:4-hydroxynonenal (HNE) in the balance. Cell Death Differ. 2013, 20, 1615–1630. [Google Scholar] [CrossRef] [PubMed] [Green Version]
- Csala, M.; Kardon, T.; Legeza, B.; Lizák, B.; Mandl, J.; Margittai, É.; Puskás, F.; Száraz, P.; Szelényi, P.; Bánhegyi, G. On the role of 4-hydroxynonenal in health and disease. Biochim. Biophys. Acta 2015, 1852, 826–838. [Google Scholar] [CrossRef] [Green Version]
- Moghe, A.; Ghare, S.; Lamoreau, B.; Mohammad, M.; Barve, S.; McClain, C.; Joshi-Barve, S. Molecular Mechanisms of Acrolein Toxicity: Relevance to Human Disease. Toxicol. Sci. 2015, 143, 242–255. [Google Scholar] [CrossRef]
- Hogard, M.L.; Lunte, C.E.; Lunte, S.M. Detection of reactive aldehyde biomarkers in biological samples using solid-phase extraction pre-concentration and liquid chromatography with fluorescence detection. Analytical. Methods 2017, 9, 1848–1854. [Google Scholar] [CrossRef]
- Zinellu, A.; Paliogiannis, P.; Usai, M.F.; Carru, C.; Mangoni, A.A. Effect of statin treatment on circulating malondialdehyde concentrations: A systematic review and meta-analysis. Ther. Adv. Chronic Dis. 2019, 10, 2040622319862714. [Google Scholar] [CrossRef]
- Qian, H.; Liu, D. The time course of malondialdehyde production following impact injury to rat spinal cord as measured by microdialysis and high pessure liquid chromatography. Neurochem. Res. 1997, 22, 1231–1236. [Google Scholar] [CrossRef] [PubMed]
- Bradley-Whitman, M.; Markesbery, W.R.; Lovell, M. Increase levels of 4-hydroxynonenal and acrolein in the brain in preclinical Alzheimer’s disease (PCAD). Free Radical. Biol. Med. 2010, 48, 1570–1576. [Google Scholar] [CrossRef] [Green Version]
- Lee, S.E.; Park, Y.S. Role of lipid peroxidation-derived α, β-unsaturated aldehydes in vascular dysfunction. Oxid. Med. Cell. Longev. 2013, 2013, 629028. [Google Scholar] [CrossRef] [PubMed] [Green Version]
- Wu, T.; Rifai, N.; Roberts, L.J., 2nd; Willett, W.C.; Rimm, E.B. Stability of measurements of biomarkers of oxidative stress in blood over 36 hours. Cancer Epidemiol. Biomark. Prev. 2004, 13, 1399–1402. [Google Scholar]
- Al-Fawaeir, S.; Akgül, E.; Caycı, T.; Demirin, H.; Kurt, Y.; Aydin, I.; Ağıllı, M.; Özkan, E.; Yaman, H.; Çakır, E.; et al. Comparison of two methods for malondialdehyde measurement. J. Clin. Anal. Med. 2011, 2, 2–4. [Google Scholar] [CrossRef]
- Lawson, J.A.; Li, H.; Rokach, J.; Adiyaman, M.; Hwang, S.W.; Khanapure, S.P.; FitzGerald, G.A. Identification of two major F2 isoprostanes, 8,12-iso- and 5-epi-8, 12-iso-isoprostane F2alpha-VI, in human urine. J. Biol. Chem. 1998, 273, 29295–29301. [Google Scholar] [CrossRef] [PubMed] [Green Version]
- Nikolaidis, M.G.; Kyparos, A.; Vrabas, I.S. F2-isoprostane formation, measurement and interpretation: The role of exercise. Prog. Lipid Res. 2011, 50, 89–103. [Google Scholar] [CrossRef]
- Kadiiska, M.B.; Gladen, B.C.; Baird, D.D.; Germolec, D.; Graham, L.B.; Parker, C.E.; Nyska, A.; Wachsman, J.T.; Ames, B.N.; Basu, S.; et al. Biomarkers of oxidative stress study II: Are oxidation products of lipids, proteins, and DNA markers of CCl4 poisoning? Free Radic. Biol. Med. 2005, 38, 698–710. [Google Scholar] [CrossRef]
- van’t Erve, T.J. Strategies to decrease oxidative stress biomarker levels in human medical conditions: A meta-analysis on 8-iso-prostaglandin F(2α). Redox Biol. 2018, 17, 284–296. [Google Scholar] [CrossRef] [PubMed]
- Lara-Guzmán, O.J.; Gil-Izquierdo, Á.; Medina, S.; Osorio, E.; Álvarez-Quintero, R.; Zuluaga, N.; Oger, C.; Galano, J.M.; Durand, T.; Muñoz-Durango, K. Oxidized LDL triggers changes in oxidative stress and inflammatory biomarkers in human macrophages. Redox Biol. 2018, 15, 1–11. [Google Scholar] [CrossRef] [PubMed]
- Itabe, H.; Obama, T.; Kato, R. The Dynamics of Oxidized LDL during Atherogenesis. J Lipids 2011, 2011, 418313. [Google Scholar] [CrossRef] [PubMed] [Green Version]
- Parthasarathy, S.; Raghavamenon, A.; Garelnabi, M.O.; Santanam, N. Oxidized low-density lipoprotein. Methods Mol. Biol. 2010, 610, 403–417. [Google Scholar] [PubMed] [Green Version]
- Levitan, I.; Volkov, S.; Subbaiah, P.V. Oxidized LDL: Diversity, patterns of recognition, and pathophysiology. Antioxid Redox Signal. 2010, 13, 39–75. [Google Scholar] [CrossRef] [Green Version]
- Itabe, H. Oxidized low-density lipoprotein as a biomarker of in vivo oxidative stress: From atherosclerosis to periodontitis. J. Clin. Biochem. Nutr. 2012, 51, 1–8. [Google Scholar] [CrossRef] [Green Version]
- Bohn, T.; Blackwood, M.; Francis, D.; Tian, Q.; Schwartz, S.J.; Clinton, S.K. Bioavailability of phytochemical constituents from a novel soy fortified lycopene rich tomato juice developed for targeted cancer prevention trials. Nutr. Cancer 2013, 65, 919–929. [Google Scholar] [CrossRef] [Green Version]
- van den Berg, V.J.; Vroegindewey, M.M.; Kardys, I.; Boersma, E.; Haskard, D.; Hartley, A.; Khamis, R. Anti-Oxidized LDL Antibodies and Coronary Artery Disease: A Systematic Review. Antioxidants 2019, 8, 484. [Google Scholar] [CrossRef] [Green Version]
- Gryszczyńska, B.; Formanowicz, D.; Budzyń, M.; Wanic-Kossowska, M.; Pawliczak, E.; Formanowicz, P.; Majewski, W.; Strzyżewski, K.W.; Kasprzak, M.P.; Iskra, M. Advanced Oxidation Protein Products and Carbonylated Proteins as Biomarkers of Oxidative Stress in Selected Atherosclerosis-Mediated Diseases. BioMed Res. Int. 2017, 2017, 4975264. [Google Scholar] [CrossRef] [Green Version]
- Taylor, E.L.; Armstrong, K.R.; Perrett, D.; Hattersley, A.T.; Winyard, P.G. Optimisation of an Advanced Oxidation Protein Products Assay: Its Application to Studies of Oxidative Stress in Diabetes Mellitus. Oxid. Med. Cell. Longev. 2015, 2015, 496271. [Google Scholar] [CrossRef] [Green Version]
- Madian, A.G.; Regnier, F.E. Proteomic identification of carbonylated proteins and their oxidation sites. J. Proteome Res. 2010, 9, 3766–3780. [Google Scholar] [CrossRef] [Green Version]
- Griffiths, H.R. Antioxidants and protein oxidation. Free Radic. Res. 2000, 33, S47–S58. [Google Scholar]
- Cayman Chemical. Cayman Chemical Protein Carbonyl Colorimetric Assay Kit; Item No 10005020; Cayman Chemical: Ann Arbor, MI, USA, 2020. [Google Scholar]
- Dalle-Donne, I.; Giustarini, D.; Colombo, R.; Rossi, R.; Milzani, A. Protein carbonylation in human diseases. Trends Mol. Med. 2003, 9, 169–176. [Google Scholar] [CrossRef]
- Hauck, A.K.; Huang, Y.; Hertzel, A.V.; Bernlohr, D.A. Adipose oxidative stress and protein carbonylation. J. Biol. Chem. 2019, 294, 1083–1088. [Google Scholar] [CrossRef] [Green Version]
- Frohnert, B.I.; Bernlohr, D.A. Protein Carbonylation, Mitochondrial Dysfunction, and Insulin Resistance. Adv. Nutr. 2013, 4, 157–163. [Google Scholar] [CrossRef] [PubMed]
- Brown, N.C.; Andreazza, A.C.; Young, L.T. An updated meta-analysis of oxidative stress markers in bipolar disorder. Psychiatry Res. 2014, 218, 61–68. [Google Scholar] [CrossRef] [PubMed]
- Goldfarb, A.H.; Cho, C.; Cho, H.; Romano-Ely, B.; Kent Todd, M. Protein and antioxidants in an isocaloric carbohydrate drink: Effect on plasma oxidative-stress markers and IL-6. Int. J. Sport Nutr. Exerc. Metab. 2009, 19, 115–126. [Google Scholar] [CrossRef] [PubMed]
- Gryszczyńska, B.; Budzyń, M.; Formanowicz, D.; Formanowicz, P.; Krasiński, Z.; Majewska, N.; Iskra, M.; Kasprzak, M.P. Advanced oxidation protein products and carbonylated protein levels in endovascular and open repair of an abdominal aortic aneurysm: The effect of pre-, intra-, and postoperative treatment. BioMed Res. Int. 2019, 2019, 7976043. [Google Scholar] [CrossRef] [Green Version]
- Guo, C.; Ding, P.; Xie, C.; Ye, C.; Ye, M.; Pan, C.; Cao, X.; Zhang, S.; Zheng, S. Potential application of the oxidative nucleic acid damage biomarkers in detection of diseases. Oncotarget 2017, 8, 75767–75777. [Google Scholar] [CrossRef] [Green Version]
- Cooke, M.S.; Olinski, R.; Loft, S. Measurement and meaning of oxidatively modified DNA lesions in urine. Cancer Epidemiol. Biomark. Prev. 2008, 17, 3–14. [Google Scholar] [CrossRef] [Green Version]
- Bolner, A.; Pilleri, M.; De Riva, V.; Nordera, G.P. Plasma and urinary HPLC-ED determination of the ratio of 8-OHdG/2-dG in Parkinson’s disease. Clin. Lab. 2011, 57, 859–866. [Google Scholar] [PubMed]
- Qi, W.; Reiter, R.; Tan, D.-X.; García García, J.; Manchester, L.; Karbownik, M.; Calvo, J. Chromium(III)-induced 8-hydroxydeoxyguanosine in DNA and Its reduction by antioxidants: Comparative effects of melatonin, ascorbate, and vitamin E. Environ. Health Persp. 2000, 108, 399–402. [Google Scholar] [CrossRef]
- Suzuki, T.; Kamiya, H. Mutations induced by 8-hydroxyguanine (8-oxo-7,8-dihydroguanine), a representative oxidized base, in mammalian cells. Genes Environ. 2017, 39, 2. [Google Scholar] [CrossRef] [Green Version]
- Graille, M.; Wild, P.; Sauvain, J.J.; Hemmendinger, M.; Guseva Canu, I.; Hopf, N.B. Urinary 8-OHdG as a Biomarker for Oxidative Stress: A Systematic Literature Review and Meta-Analysis. Int. J. Mol. Sci. 2020, 21, 3743. [Google Scholar] [CrossRef] [PubMed]
- Zabel, M.; Nackenoff, A.; Kirsch, W.M.; Harrison, F.E.; Perry, G.; Schrag, M. Markers of oxidative damage to lipids, nucleic acids and proteins and antioxidant enzymes activities in Alzheimer’s disease brain: A meta-analysis in human pathological specimens. Free Radic. Biol. Med. 2018, 115, 351–360. [Google Scholar] [CrossRef]
- Samouda, H.; De Beaufort, C.; Gilson, G.; Schritz, A.; Vaillant, M.; Ghaddhab, C.; Ruiz-Castell, M.; Huiart, L.; Dohet, F.; Weber, B.H.; et al. Relationship of oxidative stress to visceral adiposity in youth and role played by vitamin D. Pediatr. Diabetes 2020, 21, 758–765. [Google Scholar] [CrossRef]
- Collins, A.R. Measuring oxidative damage to DNA and its repair with the comet assay. Biochim. Biophys. Acta 2014, 1840, 794–800. [Google Scholar] [CrossRef]
- Muthusamy, G.; Balupillai, A.; Govindasamy, K.; Ramasamy, K.; Ponniresan, V.; Malla, I.; Nagarajan, R. Modified comet assays for the detection of cyclobutane pyrimidine dimers and oxidative base damages. J. Rad. Canc. Res. 2017, 8, 82. [Google Scholar]
- Piperakis, S. Comet assay: A brief history. Cell Biol. Toxicol 2008, 25, 1–3. [Google Scholar] [CrossRef]
- Langie, S.A.; Azqueta, A.; Collins, A.R. The comet assay: Past, present, and future. Front. Genet. 2015, 6, 266. [Google Scholar] [CrossRef] [PubMed] [Green Version]
- Gunasekarana, V.; Raj, G.V.; Chand, P. A comprehensive review on clinical applications of comet assay. J. Clin. Diagn. Res. 2015, 9, Ge01–Ge05. [Google Scholar] [CrossRef]
- Jackson, P.; Pedersen, L.M.; Kyjovska, Z.O.; Jacobsen, N.R.; Saber, A.T.; Hougaard, K.S.; Vogel, U.; Wallin, H. Validation of freezing tissues and cells for analysis of DNA strand break levels by comet assay. Mutagenesis 2013, 28, 699–707. [Google Scholar] [CrossRef] [Green Version]
- Collins, A.; Dusinská, M.; Franklin, M.; Somorovská, M.; Petrovská, H.; Duthie, S.; Fillion, L.; Panayiotidis, M.; Raslová, K.; Vaughan, N. Comet assay in human biomonitoring studies: Reliability, validation, and applications. Environ. Mol. Mutagen. 1997, 30, 139–146. [Google Scholar] [CrossRef]
- Bonassi, S.; Milić, M.; Neri, M. Frequency of micronuclei and other biomarkers of DNA damage in populations exposed to dusts, asbestos and other fibers. A systematic review. Mutat. Res. 2016, 770, 106–118. [Google Scholar] [CrossRef] [PubMed]
- Cui, Z.L.; Zheng, D.Z.; Liu, Y.H.; Chen, L.Y.; Lin, D.H.; Feng-Hua, L. Diagnostic Accuracies of the TUNEL, SCD, and Comet Based Sperm DNA Fragmentation Assays for Male Infertility: A Meta-analysis Study. Clin. Lab. 2015, 61, 525–535. [Google Scholar] [CrossRef]
- Rogakou, E.P.; Pilch, D.R.; Orr, A.H.; Ivanova, V.S.; Bonner, W.M. DNA double-stranded breaks induce histone H2AX phosphorylation on serine 139. J. Biol. Chem. 1998, 273, 5858–5868. [Google Scholar] [CrossRef] [Green Version]
- Nikitaki, Z.; Hellweg, C.E.; Georgakilas, A.G.; Ravanat, J.-L. Stress-induced DNA damage biomarkers: Applications and limitations. Front. Chem. 2015, 3, 35. [Google Scholar] [CrossRef] [PubMed] [Green Version]
- An, B.C.; Choi, Y.D.; Oh, I.J.; Kim, J.H.; Park, J.I.; Lee, S.W. GPx3-mediated redox signaling arrests the cell cycle and acts as a tumor suppressor in lung cancer cell lines. PLoS ONE 2018, 13, e0204170. [Google Scholar]
- Li, C.; Deng, X.; Xie, X.; Liu, Y.; Friedmann Angeli, J.P.; Lai, L. Activation of Glutathione Peroxidase 4 as a Novel Anti-inflammatory Strategy. Front. Pharmacol. 2018, 9, 1120. [Google Scholar] [CrossRef] [PubMed]
- Rhee, S.G.; Woo, H.A.; Kil, I.S.; Bae, S.H. Peroxiredoxin functions as a peroxidase and a regulator and sensor of local peroxides. J. Biol. Chem. 2012, 287, 4403–4410. [Google Scholar] [CrossRef] [PubMed] [Green Version]
- Yang, S.; Jensen, M.K.; Rimm, E.B.; Willett, W.; Wu, T. Erythrocyte Superoxide Dismutase, Glutathione Peroxidase, and Catalase Activities and Risk of Coronary Heart Disease in Generally Healthy Women: A Prospective Study. Am. J. Epidemiol. 2014, 180, 901–908. [Google Scholar] [CrossRef] [Green Version]
- Bolzán, A.D.; Bianchi, M.S.; Bianchi, N.O. Superoxide dismutase, catalase and glutathione peroxidase activities in human blood: Influence of sex, age and cigarette smoking. Clin. Biochem. 1997, 30, 449–454. [Google Scholar] [CrossRef]
- Li, J.; Lei, J.; He, L.; Fan, X.; Yi, F.; Zhang, W. Evaluation and monitoring of superoxide dismutase (SOD) activity and its clinical significance in gastric cancer: A systematic review and meta-analysis. Med. Sci. Monit. 2019, 25, 2032–2042. [Google Scholar] [CrossRef] [PubMed]
- Wang, D.-F.; Cao, B.; Xu, M.-Y.; Liu, Y.-Q.; Yan, L.-L.; Liu, R.; Wang, J.-Y.; Lu, Q.-B. Meta-Analyses of Manganese Superoxide Dismutase Activity, Gene Ala-9Val Polymorphism, and the Risk of Schizophrenia. Medicine 2015, 94, e1507. [Google Scholar] [CrossRef] [PubMed]
- Wolf, G.; Aumann, N.; Michalska, M.; Bast, A.; Sonnemann, J.; Beck, J.F.; Lendeckel, U.; Newsholme, P.; Walther, R. Peroxiredoxin III protects pancreatic ß cells from apoptosis. J. Endocrinol. 2010, 207, 163–175. [Google Scholar] [CrossRef]
- Shahidi, F.; Zhong, Y. Measurement of antioxidant activity. J. Funct. Foods 2015, 18, 757–781. [Google Scholar] [CrossRef]
- Pellegrini, N.; Vitaglione, P.; Granato, D.; Fogliano, V. Twenty-five years of total antioxidant capacity measurement of foods and biological fluids: Merits and limitations. J. Sci. Fd. Agric. 2018, 2019, 5064–5078. [Google Scholar] [CrossRef] [PubMed]
- Peluso, I.; Raguzzini, A. Salivary and Urinary Total Antioxidant Capacity as Biomarkers of Oxidative Stress in Humans. Patholog. Res. Int. 2016, 2016, 5480267. [Google Scholar] [CrossRef] [Green Version]
- Alam, M.N.; Bristi, N.J.; Rafiquzzaman, M. Review on in vivo and in vitro methods evaluation of antioxidant activity. Saudi Pharm. J. 2013, 21, 143–152. [Google Scholar] [CrossRef] [PubMed] [Green Version]
- Sunitha, D. A review on antioxidant methods. As. J. Pharm. Clin. Res. 2016, 9, 14–32. [Google Scholar] [CrossRef]
- Gulcin, İ. Antioxidants and antioxidant methods: An updated overview. Arch. Toxicol. 2020, 94, 651–715. [Google Scholar] [CrossRef] [Green Version]
- Schneider, C.D.; Bock, P.M.; Becker, G.F.; Moreira, J.C.F.; Bello-Klein, A.; Oliveira, A.R. Comparison of the effects of two antioxidant diets on oxidative stress markers in triathletes. Biol. Sport 2018, 35, 181–189. [Google Scholar] [CrossRef]
- The Human Proteome Atlas Nrf2. Available online: https://wwwproteinatlasorg/ENSG00000116044-NFE2L2/tissue (accessed on 19 June 2020).
- Shang, H.; Yang, D.; Zhang, W.; Li, T.; Ren, X.; Wang, X.; Zhao, W. Time course of Keap1-Nrf2 pathway expression after experimental intracerebral haemorrhage: Correlation with brain oedema and neurological deficit. Free Radic. Res. 2013, 47, 368–375. [Google Scholar] [CrossRef]
- Watai, Y.; Kobayashi, A.; Nagase, H.; Mizukami, M.; McEvoy, J.; Singer, J.D.; Itoh, K.; Yamamoto, M. Subcellular localization and cytoplasmic complex status of endogenous Keap1. Genes Cells 2007, 12, 1163–1178. [Google Scholar] [CrossRef]
- Ruelas Cinco, E.D.C.; Ruíz Madrigal, B.; Domínguez Rosales, J.A.; Maldonado González, M.; De la Cruz Color, L.; Ramírez Meza, S.M.; Torres Baranda, J.R.; Martínez López, E.; Hernández Nazará, Z.H. Expression of the receptor of advanced glycation end-products (RAGE) and membranal location in peripheral blood mononuclear cells (PBMC) in obesity and insulin resistance. Irani. J. Bas Med. Sci. 2019, 22, 623–630. [Google Scholar]
- Jimenez-Osorio, A.S.; Gonzalez-Reyes, S.; Garcia-Nino, W.R.; Moreno-Macias, H.; Rodriguez-Arellano, M.E.; Vargas-Alarcon, G.; Zuniga, J.; Barquera, R.; Pedraza-Chaverri, J. Association of nuclear factor-erythroid 2-related factor 2, thioredoxin interacting protein, and heme oxygenase-1 gene polymorphisms with diabetes and obesity in mexican patients. Oxid. Med. Cell. Longev. 2016, 2016, 7367641. [Google Scholar] [CrossRef]
- Rodriguez, D.; Bethencourt, A.; Ortet, D.; Kerna, N. The protective effect of Nrf2 activation in cardiovascular disease. EC Cardiol. 2019, 6, 78–82. [Google Scholar]
- Dodson, M.; de la Vega, M.R.; Cholanians, A.B.; Schmidlin, C.J.; Chapman, E.; Zhang, D.D. Modulating NRF2 in Disease: Timing Is Everything. Annu. Rev. Pharmacol. Toxicol. 2019, 59, 555–575. [Google Scholar] [CrossRef]
- Bagan, J.; Sáez, G.T.; Tormos, M.C.; Gavalda-Esteve, C.; Bagan, L.; Leopoldo-Rodado, M.; Calvo, J.; Camps, C. Oxidative stress in bisphosphonate-related osteonecrosis of the jaws. J. Oral. Pathol. Med. 2014, 43, 371–377. [Google Scholar] [CrossRef] [PubMed]
- Tietze, F. Enzymic method for quantitative determination of nanogram amounts of total and oxidized glutathione: Applications to mammalian blood and other tissues. Anal. Biochem. 1969, 27, 502–522. [Google Scholar] [CrossRef]
- Nsonwu-Anyanwu, A.C.; Agu, C.E. Cardiovascular risk factors and oxidative stress indices in obese women in Southern Nigeria. React. Ox. Spec. 2019, 7, 176–187. [Google Scholar] [CrossRef] [Green Version]
- Cutler, R.G.; Plummer, J.; Chowdhury, K.; Heward, C. Oxidative stress profiling: Part II. Theory, technology, and practice. Ann. N. Y. Acad. Sci. 2005, 1055, 136–158. [Google Scholar] [CrossRef] [PubMed]
- Tafuri, S.; Cocchia, N.; Landolfi, F.; Iorio, E.; Ciani, F. Redoxomics and Oxidative Stress: From the Basic Research to the Clinical Practice. In Free Radicals and Diseases; INTECH Open: London, UK, 2016; pp. 149–169. [Google Scholar]
- Ma, N.L.; Rahmat, Z.; Lam, S.S. A review of the “Omics” approach to biomarkers of oxidative stress in Oryza sativa. Int. J. Mol. Sci. 2013, 14, 7515–7541. [Google Scholar] [CrossRef]
- Colzani, M.; Aldini, G.; Carini, M. Mass spectrometric approaches for the identification and quantification of reactive carbonyl species protein adducts. J. Proteom. 2013, 92, 28–50. [Google Scholar] [CrossRef]
- Di Domenico, F.; Pupo, G.; Tramutola, A.; Giorgi, A.; Schininà, M.E.; Coccia, R.; Head, E.; Butterfield, D.A.; Perluigi, M. Redox proteomics analysis of HNE-modified proteins in Down syndrome brain: Clues for understanding the development of Alzheimer disease. Free Radical. Biol. Med. 2014, 71, 270–280. [Google Scholar] [CrossRef] [Green Version]
- Sultana, R.; Poon, H.F.; Cai, J.; Pierce, W.M.; Merchant, M.; Klein, J.B.; Markesbery, W.R.; Butterfield, D.A. Identification of nitrated proteins in Alzheimer’s disease brain using a redox proteomics approach. Neurobiol. Dis. 2006, 22, 76–87. [Google Scholar] [CrossRef] [PubMed]
- Butterfield, D.A.; Perluigi, M. Redox Proteomics: A Key Tool for New Insights into Protein Modification with Relevance to Disease. Antioxid. Redox Signal. 2017, 26, 277–279. [Google Scholar] [CrossRef] [PubMed] [Green Version]
- Andrisic, L.; Dudzik, D.; Barbas, C.; Milkovic, L.; Grune, T.; Zarkovic, N. Short overview on metabolomics approach to study pathophysiology of oxidative stress in cancer. Redox Biol. 2018, 14, 47–58. [Google Scholar] [CrossRef] [PubMed]
- Mendiola, A.; Ryu, J.; Bardehle, S.; Meyer-Franke, A.; Ang, K.; Wilson, C.; Baeten, K.; Hanspers, K.; Merlini, M.; Thomas, S.; et al. Transcriptional profiling and therapeutic targeting of oxidative stress in neuroinflammation. Nat. Immunol. 2020, 21, 513–524. [Google Scholar] [CrossRef]
- Zhou, M.; Jiang, B.; Xiong, M.; Zhu, X. An Updated Meta-Analysis of the Associations Between MicroRNA Polymorphisms and Susceptibility to Rheumatoid Arthritis. Front. Physiol. 2018, 9, 1604. [Google Scholar] [CrossRef] [PubMed]
- Konovalova, J.; Gerasymchuk, D.; Parkkinen, I.; Chmielarz, P.; Domanskyi, A. Interplay between MicroRNAs and Oxidative Stress in Neurodegenerative Diseases. Int. J. Mol. Sci. 2019, 20, 6055. [Google Scholar] [CrossRef] [Green Version]
- Schmiedel, J.M.; Klemm, S.L.; Zheng, Y.; Sahay, A.; Blüthgen, N.; Marks, D.S.; van Oudenaarden, A. Gene expression. MicroRNA control of protein expression noise. Science 2015, 348, 128–132. [Google Scholar] [CrossRef]
- Luu, H.N.; Wen, W.; Li, H.; Dai, Q.; Yang, G.; Cai, Q.; Xiang, Y.-B.; Gao, Y.-T.; Zheng, W.; Shu, X.-O. Are dietary antioxidant intake indices correlated to oxidative stress and inflammatory marker levels? Antiox. Redox Signal. 2015, 22, 951–959. [Google Scholar] [CrossRef] [Green Version]
- Puchau, B.; Zulet, M.Á.; de Echávarri, A.G.; Hermsdorff, H.H.M.; Martínez, J.A. Dietary Total Antioxidant Capacity: A Novel Indicator of Diet Quality in Healthy Young Adults. J. Am. Coll. Nutr. 2009, 28, 648–656. [Google Scholar] [CrossRef] [PubMed] [Green Version]
- Kolarzyk, E.; Pietrzycka, A.; Zając, J.; Morawiecka-Baranek, J. Relationship between dietary antioxidant index (DAI) and antioxidants level in plasma of Kraków inhabitants. Adv. Clin. Exp. Med. 2017, 26, 393–399. [Google Scholar] [CrossRef] [PubMed] [Green Version]
- Abshirini, M.; Siassi, F.; Koohdani, F.; Qorbani, M.; Mozaffari, H.; Aslani, Z.; Soleymani, M.; Entezarian, M.; Sotoudeh, G. Dietary total antioxidant capacity is inversely associated with depression, anxiety and some oxidative stress biomarkers in postmenopausal women: A cross-sectional study. Ann. Gen. Psychiatry 2019, 18, 3. [Google Scholar] [CrossRef] [PubMed]
- Re Med Oxidative Stress Questionnaire. Available online: https://remed.com.au/wp-content/uploads/2019/06/Oxidative-Stress-Questionnaire-2017.pdf (accessed on 14 December 2020).
- Hassan, A.; El-Magd, S.; Ghareeb, A.; Bolbol, S. Assessment of oxidative stress and antioxidant status among petrol station workers exposed to benzene in Zagazig city. Zagazig Univ. Med. J. 2013, 19, 1–12. [Google Scholar] [CrossRef] [Green Version]
- Oyewole, I.; Anyasor, G.N.; Ogunwenmo, K.O.; Ayodele, S. Antioxidant and oxidative stress status in human Plasmodium malaria. Der Pharm. Lett. 2011, 3, 91–96. [Google Scholar]
- Cohen, L.; Keegan, A.; Melanson, S.; Walt, D. Impact of clinical sample handling and processing on ultra-low level measurements of plasma cytokines. Clin. Biochem. 2019, 65, 38–44. [Google Scholar] [CrossRef]
- de Jager, W.; Bourcier, K.; Rijkers, G.T.; Prakken, B.J.; Seyfert-Margolis, V. Prerequisites for cytokine measurements in clinical trials with multiplex immunoassays. BMC Immunol. 2009, 10, 52. [Google Scholar] [CrossRef] [PubMed] [Green Version]
- Elshal, M.F.; McCoy, J.P. Multiplex bead array assays: Performance evaluation and comparison of sensitivity to ELISA. Methods 2006, 38, 317–323. [Google Scholar] [CrossRef] [PubMed] [Green Version]
- Bradburn, S.; Sarginson, J.; Murgatroyd, C.A. Association of Peripheral Interleukin-6 with Global Cognitive Decline in Non-demented Adults: A Meta-Analysis of Prospective Studies. Front. Aging NeuroSci. 2017, 9, 438. [Google Scholar] [CrossRef] [PubMed]
- Coomes, E.A.; Haghbayan, H. Interleukin-6 in COVID-19: A systematic review and meta-analysis. Rev. Med. Virol. 2020, 2020. [Google Scholar] [CrossRef]
- Bashashati, M.; Moradi, M.; Sarosiek, I. Interleukin-6 in irritable bowel syndrome: A systematic review and meta-analysis of IL-6 (-G174C) and circulating IL-6 levels. Cytokine 2017, 99, 132–138. [Google Scholar] [CrossRef]
- Gholami, M.; Sharifi, F.; Shahriari, S.; Khoshnevisan, K.; Larijani, B.; Amoli, M.M. Association of interleukin-6 polymorphisms with obesity: A systematic review and meta-analysis. Cytokine 2019, 123, 154769. [Google Scholar] [CrossRef] [PubMed]
- Mao, Y.-M.; Zhao, C.-N.; Liu, L.-N.; Wu, Q.; Dan, Y.-L.; Wang, D.-G.; Pan, H.-F. Increased circulating interleukin-8 levels in systemic lupus erythematosus patients: A meta-analysis. Biomark. Med. 2018, 12, 1291–1302. [Google Scholar] [CrossRef]
- Shakiba, E.; Sadeghi, M.; Shakiba, M. A systematic review and meta-analysis of evaluation of serum interleukin 8 levels in hepatocellular carcinoma. Clin. Exp. Hepatol. 2019, 5, 123–128. [Google Scholar] [CrossRef] [PubMed]
- Ni, X.B.; Jia, C.; Yu, H.D.; Li, Y.Q.; Zeng, X.T.; Leng, W.D. Comprehensive analysis of interleukin-8 gene polymorphisms and periodontitis susceptibility. Oncotarget 2017, 8, 48996–49004. [Google Scholar] [CrossRef] [PubMed]
- Duffles, L.F.; Hermont, A.P.; Abreu, L.G.; Pordeus, I.A.; Silva, T.A. Association between obesity and adipokines levels in saliva and gingival crevicular fluid: A systematic review and meta-analysis. J. Evid. Based Med. 2019, 12, 313–324. [Google Scholar] [CrossRef]
- Li, C.J.; Dai, Y.; Fu, Y.J.; Tian, J.M.; Li, J.L.; Lu, H.J.; Duan, F.; Li, Q.W. Correlations of IFN-γ genetic polymorphisms with susceptibility to breast cancer: A meta-analysis. Tumour Biol. 2014, 35, 6867–6877. [Google Scholar] [CrossRef] [PubMed]
- Sun, Y.; Lu, y.; Pen, Q.; Li, T.; Xie, L.; Deng, Y.; Qin, A. Interferon gamma +874 T/A polymorphism increases the risk of cervical cancer: Evidence from a meta-analysis. Tumour Biol. 2015, 36, 4555–4564. [Google Scholar] [CrossRef] [PubMed]
- Wang, Y.; Zhang, Y.; Lu, W.; Wang, L. Serum tumor necrosis factor-α and interferon-γ levels in pediatric Mycoplasma pneumoniae Pneumonia: A systematic review and meta-analysis. Can. Resp. J. 2018, 2018, 8354892. [Google Scholar]
- Alzamil, H. Elevated serum TNFα is related to obesity in type 2 diabetes mellitus and is associated with glycemic control and insulin resistance. J. Obes. 2020, 2020, 5076858. [Google Scholar] [CrossRef] [PubMed] [Green Version]
- Liu, C.; Feng, X.; Li, Q.; Wang, Y.; Li, Q.; Hua, M. Adiponectin, TNF-α and inflammatory cytokines and risk of type 2 diabetes: A systematic review and meta-analysis. Cytokine 2016, 86, 100–109. [Google Scholar] [CrossRef]
- Gui, Y.; Pan, Q.; Chen, X.; Xu, S.; Luo, X.; Chen, L. The association between obesity related adipokines and risk of breast cancer: A meta-analysis. Oncotarget 2017, 8, 75389–75399. [Google Scholar] [CrossRef] [Green Version]
- Daves, M.; Zagler, E.M.; Cemin, R.; Gnech, F.; Joos, A.; Platzgummer, S.; Lippi, G. Sample stability for complete blood cell count using the Sysmex XN haematological analyser. Blood Transfus. 2015, 13, 576–582. [Google Scholar]
- Tang, O.; Selvin, E.; Arends, V.; Saenger, A. Short-Term Stability of Hematologic Parameters in Frozen Whole Blood. J. Appl. Lab. Med. 2019, 4, 410–414. [Google Scholar] [CrossRef]
- Vembadi, A.; Menachery, A.; Qasaimeh, M.A. Cell Cytometry: Review and Perspective on Biotechnological Advances. Front. Bioeng. Biotechnol. 2019, 7, 147. [Google Scholar] [CrossRef]
- de Labry, L.O.; Campion, E.W.; Glynn, R.J.; Vokonas, P.S. White blood cell count as a predictor of mortality: Results over 18 years from the Normative Aging Study. J. Clin. Epidemiol. 1990, 43, 153–157. [Google Scholar] [CrossRef]
- Hemmati, R.; Rastaghi, S.; Sarmadi, M.; Bidel, Z.; Menati, W. Elevated white blood cell counts and risk of metabolic syndrome: A dose-response meta-analysis. Sci. J. Kurd. Univ. Med. Sci. 2019, 24, 1–16. [Google Scholar]
- Gkrania-Klotsas, E.; Ye, Z.; Cooper, A.J.; Sharp, S.J.; Luben, R.; Biggs, M.L.; Chen, L.K.; Gokulakrishnan, K.; Hanefeld, M.; Ingelsson, E.; et al. Differential white blood cell count and type 2 diabetes: Systematic review and meta-analysis of cross-sectional and prospective studies. PLoS ONE 2010, 5, e13405. [Google Scholar] [CrossRef] [Green Version]
- Huang, I.; Pranata, R. Lymphopenia in severe coronavirus disease-2019 (COVID-19): Systematic review and meta-analysis. J. Intensive Care 2020, 8, 36. [Google Scholar] [CrossRef]
- HIV Paediatric Prognostic Markers Collaborative Study. Use of total lymphocyte count for informing when to start antiretroviral therapy in HIV-infected children: A meta-analysis of longitudinal data. Lancet 2005, 366, 1868–1874. [Google Scholar] [CrossRef]
- Klonoff-Cohen, H.; Polavarapu, M. Eosinophil protein X and childhood asthma: A systematic review and meta-analysis. Immun. Inflamm. Dis. 2016, 4, 114–134. [Google Scholar] [CrossRef] [Green Version]
- Stewart, M.J.; Shaffer, E.; Urbanski, S.J.; Beck, P.L.; Storr, M.A. The association between celiac disease and eosinophilic esophagitis in children and adults. BMC Gastroenterol. 2013, 13, 96. [Google Scholar] [CrossRef] [PubMed] [Green Version]
- Mehta, P.; Furuta, G.T. Eosinophils in Gastrointestinal Disorders: Eosinophilic Gastrointestinal Diseases, Celiac Disease, Inflammatory Bowel Diseases, and Parasitic Infections. Immunol. Allergy Clin. N. Am. 2015, 35, 413–437. [Google Scholar] [CrossRef] [Green Version]
- Falchi, L.; Verstovsek, S. Eosinophilia in Hematologic Disorders. Immunol. Allergy Clin. N. Am. 2015, 35, 439–452. [Google Scholar] [CrossRef] [PubMed] [Green Version]
- Ortega-Pajares, A.; Rogerson, S.J. The Rough Guide to Monocytes in Malaria Infection. Front. Immunol. 2018, 9, 2888. [Google Scholar] [CrossRef] [PubMed]
- Budman, D.R.; Steinberg, A.D. Hematologic aspects of systemic lupus erythematosus. Current concepts. Ann. Intern. Med. 1977, 86, 220–229. [Google Scholar] [CrossRef]
- Wen, S.; Chen, N.; Peng, J.; Ling, W.; Fang, Q.; Yin, S.-f.; He, X.; Qiu, M.; Hu, Y. Peripheral monocyte counts predict the clinical outcome for patients with colorectal cancer: A systematic review and meta-analysis. Eur. J. Gastroenterol. Hepatol. 2019, 31, 1313–1321. [Google Scholar] [CrossRef] [PubMed]
- Nagareddy, P.R.; Kraakman, M.; Masters, S.L.; Stirzaker, R.A.; Gorman, D.J.; Grant, R.W.; Dragoljevic, D.; Hong, E.S.; Abdel-Latif, A.; Smyth, S.S.; et al. Adipose tissue macrophages promote myelopoiesis and monocytosis in obesity. Cell Metab. 2014, 19, 821–835. [Google Scholar] [CrossRef] [PubMed] [Green Version]
- Mazza, M.G.; Capellazzi, M.; Lucchi, S.; Tagliabue, I.; Rossetti, A.; Clerici, M. Monocyte count in schizophrenia and related disorders: A systematic review and meta-analysis. Acta Neuropsychiatr. 2020, 32, 229–236. [Google Scholar] [CrossRef] [PubMed]
- Amundsen, E.K.; Henriksson, C.E.; Holthe, M.R.; Urdal, P. Is the blood basophil count sufficiently precise, accurate, and specific? Three automated hematology instruments and flow cytometry compared. Am. J. Clin. Pathol. 2012, 137, 86–92. [Google Scholar] [CrossRef] [PubMed]
- Siracusa, M.C.; Kim, B.S.; Spergel, J.M.; Artis, D. Basophils and allergic inflammation. J. Allergy Clin. Immunol. 2013, 132, 789–801. [Google Scholar] [CrossRef] [Green Version]
- Maidhof, W.; Hilas, O. Lupus: An overview of the disease and management options. Pharm. Ther. 2012, 37, 240–249. [Google Scholar]
- Hussain, M.; Babar, M.Z.M.; Akhtar, L.; Hussain, M.S. Neutrophil lymphocyte ratio (NLR): A well assessment tool of glycemic control in type 2 diabetic patients. Pak. J. Med. Sci. 2017, 33, 1366–1370. [Google Scholar] [CrossRef] [PubMed]
- Templeton, A.J.; McNamara, M.G.; Šeruga, B.; Vera-Badillo, F.E.; Aneja, P.; Ocaña, A.; Leibowitz-Amit, R.; Sonpavde, G.; Knox, J.J.; Tran, B.; et al. Prognostic role of neutrophil-to-lymphocyte ratio in solid tumors: A systematic review and meta-analysis. J. Natl. Cancer Inst. 2014, 106, 124. [Google Scholar] [CrossRef] [PubMed] [Green Version]
- Ren, H.; Liu, X.; Wang, L.; Gao, Y. Lymphocyte-to-Monocyte Ratio: A Novel Predictor of the Prognosis of Acute Ischemic Stroke. J. Stroke Cerebrovasc. Dis. 2017, 26, 2595–2602. [Google Scholar] [CrossRef] [Green Version]
- Gong, J.; Jiang, H.; Shu, C.; Hu, M.Q.; Huang, Y.; Liu, Q.; Li, R.F. Prognostic value of lymphocyte-to-monocyte ratio in ovarian cancer: A meta-analysis. J. Ovarian Res. 2019, 12, 51. [Google Scholar] [CrossRef]
- Nishijima, T.F.; Muss, H.B.; Shachar, S.S.; Tamura, K.; Takamatsu, Y. Prognostic value of lymphocyte-to-monocyte ratio in patients with solid tumors: A systematic review and meta-analysis. Cancer Treat. Rev. 2015, 41, 971–978. [Google Scholar] [CrossRef]
- Yang, R.; Chang, Q.; Meng, X.; Gao, N.; Wang, W. Prognostic value of Systemic immune-inflammation index in cancer: A meta-analysis. J. Cancer 2018, 9, 3295–3302. [Google Scholar] [CrossRef]
- Doumatey, A.P.; Zhou, J.; Adeyemo, A.; Rotimi, C. High sensitivity C-reactive protein (Hs-CRP) remains highly stable in long-term archived human serum. Clin. Biochem. 2014, 47, 315–318. [Google Scholar] [CrossRef] [Green Version]
- Dong, M.; Wu, J.; Ma, Z.; Peretz-Soroka, H.; Zhang, M.; Komenda, P.; Tangri, N.; Liu, Y.; Rigatto, C.; Lin, F. Rapid and Low-Cost CRP Measurement by Integrating a Paper-Based Microfluidic Immunoassay with Smartphone (CRP-Chip). Sensors 2017, 17, 684. [Google Scholar] [CrossRef]
- Qiu, X.; Xiao, Y.; Wu, J.; Gan, L.; Huang, Y.; Wang, J. C-Reactive Protein and Risk of Parkinson’s Disease: A Systematic Review and Meta-Analysis. Front. Neurol. 2019, 10, 384. [Google Scholar] [CrossRef]
- Kaptoge, S.; Di Angelantonio, E.; Lowe, G.; Pepys, M.B.; Thompson, S.G.; Collins, R.; Danesh, J. C-reactive protein concentration and risk of coronary heart disease, stroke, and mortality: An individual participant meta-analysis. Lancet 2010, 375, 132–140. [Google Scholar] [PubMed] [Green Version]
- Thomson, L.; Tenopoulou, M.; Lightfoot, R.; Tsika, E.; Parastatidis, I.; Martinez, M.; Greco, T.M.; Doulias, P.T.; Wu, Y.; Tang, W.H.; et al. Immunoglobulins against tyrosine-nitrated epitopes in coronary artery disease. Circulation 2012, 126, 2392–2401. [Google Scholar] [CrossRef] [PubMed] [Green Version]
- Mitrogianni, Z.; Barbouti, A.; Galaris, D.; Siamopoulos, K.C. Tyrosine nitration in plasma proteins from patients undergoing hemodialysis. Am. J. Kidney Dis. 2004, 44, 286–292. [Google Scholar] [CrossRef] [PubMed] [Green Version]
- Schwartz, D.; Pusterla, N.; Jacobsen, S.; Christopher, M.M. Analytical validation of a new point-of-care assay for serum amyloid A in horses. Equine Vet. J. 2018, 50, 678–683. [Google Scholar] [CrossRef] [Green Version]
- Yamada, T. Serum amyloid A (SAA): A concise review of biology, assay methods and clinical usefulness. Clin. Chem. Lab. Med. 1999, 37, 381–388. [Google Scholar] [CrossRef] [PubMed]
- Lin, H.Y.; Tan, G.Q.; Liu, Y.; Lin, S.Q. The prognostic value of serum amyloid A in solid tumors: A meta-analysis. Cancer Cell Int. 2019, 19, 62. [Google Scholar] [CrossRef]
- Biaoxue, R.; Hua, L.; Wenlong, G.; Shuanying, Y. Increased serum amyloid A as potential diagnostic marker for lung cancer: A meta-analysis based on nine studies. BMC Cancer 2016, 16, 836. [Google Scholar] [CrossRef] [Green Version]
- PGM, A.M.; Moriel, P.; Arthington, J.D. Effects of storage temperature and repeated freeze-thaw cycles on stability of bovine plasma concentrations of haptoglobin and ceruloplasmin. J. Vet. Diagn. Investig. 2017, 29, 738–740. [Google Scholar]
- Gutiérrez, A.M.; Martínez-Subiela, S.; Cerón, J.J. Evaluation of changes in haptoglobin and C-reactive protein concentrations caused by freezing of saliva and meat juice samples collected from healthy and diseased pigs. Am. J. Vet. Res. 2011, 72, 11–17. [Google Scholar] [CrossRef] [PubMed]
- Lipperheide, C.; Diepers, N.; Lampreave, F.; Alava, M.; Petersen, B. Nephelometric determination of haptoglobin plasma concentrations in fattening pigs. Zent. Vet. A 1998, 45, 543–550. [Google Scholar] [CrossRef] [PubMed]
- Asleh, R.; Briasoulis, A.; Berinstein, E.M.; Wiener, J.B.; Palla, M.; Kushwaha, S.S.; Levy, A.P. Meta-analysis of the association of the haptoglobin genotype with cardiovascular outcomes and the pharmacogenomic interactions with vitamin E supplementation. Pharmgenomics Pers Med. 2018, 11, 71–82. [Google Scholar] [CrossRef] [Green Version]
- Barcellini, W.; Fattizzo, B. Clinical Applications of Hemolytic Markers in the Differential Diagnosis and Management of Hemolytic Anemia. Dis. Markers 2015, 2015, 635670. [Google Scholar] [CrossRef] [Green Version]
- Ben-Hadj-Mohamed, M.; Khelil, S.; Ben Dbibis, M.; Khlifi, L.; Chahed, H.; Ferchichi, S.; Bouajina, E.; Miled, A. Hepatic Proteins and Inflammatory Markers in Rheumatoid Arthritis Patients. Iran. J. Public Health 2017, 46, 1071–1078. [Google Scholar] [PubMed]
- MyBioSource Recombinant Mannose Binding Lectin (MBL). Catalog: MBS2030072. 2020. Available online: https://www.labome.com/product/MyBioSource/MBS2030072.html (accessed on 23 December 2020).
- Zhang, A.Q.; Yue, C.L.; Pan, W.; Gao, J.W.; Zeng, L.; Gu, W.; Jiang, J.X. Mannose-binding lectin polymorphisms and the risk of sepsis: Evidence from a meta-analysis. Epidemiol. Infect. 2014, 142, 2195–2206. [Google Scholar] [CrossRef]
- Kalia, N.; Singh, J.; Rauniyar, A.K.; Kaur, M. A meta-analysis of mannose-binding lectin gene polymorphisms with the risk of recurrent vulvovaginal infections. Sci. Rep. 2020, 10, 6079. [Google Scholar] [CrossRef] [Green Version]
- Xu, H.D.; Zhao, M.F.; Wan, T.H.; Song, G.Z.; He, J.L.; Chen, Z. Association between Mannose-binding lectin gene polymorphisms and hepatitis B virus infection: A meta-analysis. PLoS ONE 2013, 8, e75371. [Google Scholar] [CrossRef]
- Schuetz, P.; Christ-Crain, M.; Huber, A.R.; Müller, B. Long-term stability of procalcitonin in frozen samples and comparison of Kryptor and VIDAS automated immunoassays. Clin. Biochem. 2010, 43, 341–344. [Google Scholar] [CrossRef]
- Kamat, I.S.; Ramachandran, V.; Eswaran, H.; Guffey, D.; Musher, D.M. Procalcitonin to Distinguish Viral From Bacterial Pneumonia: A Systematic Review and Meta-analysis. Clin. Infect. Dis. 2019, 70, 538–542. [Google Scholar] [CrossRef] [Green Version]
- Cheung, D.A.; Tamariz, L.; Nemeth, Z.; Langshaw, A.H. Usefulness of Procalcitonin in Inflammatory Bowel Disease: A Systematic Review and Meta-analysis. Crohn’s Colitis 360 2019, 1, otz032. [Google Scholar] [CrossRef]
- Qiu, S.; Cai, X.; Liu, J.; Yang, B.; Zügel, M.; Steinacker, J.M.; Sun, Z.; Schumann, U. Association between circulating cell adhesion molecules and risk of type 2 diabetes: A meta-analysis. Atherosclerosis 2019, 287, 147–154. [Google Scholar] [CrossRef]
- Cheng, D.; Liang, B. Intercellular Adhesion Molecule-1 (ICAM-1) Polymorphisms and Cancer Risk: A Meta-Analysis. Iran. J. Public Health 2015, 44, 615–624. [Google Scholar] [PubMed]
- Mi, W.; Xia, Y.; Bian, Y. The influence of ICAM1 rs5498 on diabetes mellitus risk: Evidence from a meta-analysis. Inflamm. Res. 2019, 68, 275–284. [Google Scholar] [CrossRef] [PubMed]
- Yin, D.; Zhao, X.; Zhou, Y.C.; Wang, Y.; Duan, P.; Li, Q.; Xiong, Z.Q.; Zhang, Y.; Chen, Y.; He, H.Q.; et al. Association between the ICAM-1 gene polymorphism and coronary heart disease risk: A meta-analysis. BioSci. Rep. 2019, 39, BSR20180923. [Google Scholar] [CrossRef] [Green Version]
- Li, X.; Tang, Q.; Liu, S.; Xu, Y.; Li, M.; Cao, C.; Zhang, L. Evaluation of vascular cell adhesion molecule-1, intracellular cell adhesion molecule-1 and E-selectin levels in preeclampsia: A systematic review and meta-analysis. Res. Sq. 2020. [Google Scholar] [CrossRef]
- Ozen, G.; Boumiza, S.; Deschildre, C.; Topal, G.; Longrois, D.; Jakobsson, P.J.; Michel, J.B.; Jacob, M.P.; Chahed, K.; Norel, X. Inflammation increases MMP levels via PGE2 in human vascular wall and plasma of obese women. Int. J. Obes. 2019, 43, 1724–1734. [Google Scholar] [CrossRef]
- Doherty, G.A.; Byrne, S.M.; Molloy, E.S.; Malhotra, V.; Austin, S.C.; Kay, E.W.; Murray, F.E.; Fitzgerald, D.J. Proneoplastic effects of PGE2 mediated by EP4 receptor in colorectal cancer. BMC Cancer 2009, 9, 207. [Google Scholar] [CrossRef] [Green Version]
- Rask, K.; Zhu, Y.; Wang, W.; Hedin, L.; Sundfeldt, K. Ovarian epithelial cancer: A role for PGE2-synthesis and signalling in malignant transformation and progression. Mol. Cancer 2006, 5, 62. [Google Scholar] [CrossRef] [Green Version]
- Fenske, R.J.; Weeks, A.C.; Brill, A.L.; Nall, R.; Pabitch, S.; Punt, M.; Daniels, M.J.; Blaha, S.; Davis, D.B.; Kimple, M.E. Prostaglandin E2 (PGE2) Levels As a Predictor of Type 2 Diabetes Control in Human Subjects: A cross-sectional view of initial cohort study data. FASEB J. 2017, 31, 675.6. [Google Scholar]
- Famitafreshi, H.; Karimian, M. Prostaglandins as the Agents That Modulate the Course of Brain Disorders. Degener. Neurol. Neuromuscul. Dis. 2020, 10, 1–13. [Google Scholar] [CrossRef]
- Cloud Clone Corp. User Manual SEB824Ra 96 Tests Enzyme-Linked Immunosorbent Assay Kit for Nuclear Factor Kappa B (NFkB); Cloud Clone Corp.: Katy, TX, USA, 2019. [Google Scholar]
- Gu, L.; Wang, Z.; Zuo, J.; Li, H.; Zha, L. Prognostic significance of NF-κB expression in non-small cell lung cancer: A meta-analysis. PLoS ONE 2018, 13, e0198223. [Google Scholar] [CrossRef]
- Green, C.J.; Pedersen, M.; Pedersen, B.K.; Scheele, C. Elevated NF-κB Activation Is Conserved in Human Myocytes Cultured From Obese Type 2 Diabetic Patients and Attenuated by AMP-Activated Protein Kinase. Diabetes 2011, 60, 2810. [Google Scholar] [CrossRef] [Green Version]
- Bjørnestad, E.; Borsholm, R.A.; Svingen, G.F.T.; Pedersen, E.R.; Seifert, R.; Midttun, Ø.; Ueland, P.M.; Tell, G.S.; Bønaa, K.H.; Nygård, O. Neopterin as an Effect Modifier of the Cardiovascular Risk Predicted by Total Homocysteine: A Prospective 2-Cohort Study. J. Am. Heart Assoc. 2017, 6, e006500. [Google Scholar] [CrossRef] [Green Version]
- Volgger, B.M.; Windbichler, G.H.; Zeimet, A.G.; Graf, A.H.; Bogner, G.; Angleitner-Boubenizek, L.; Rohde, M.; Denison, U.; Sliutz, G.; Fuith, L.C.; et al. Long-term significance of urinary neopterin in ovarian cancer: A study by the Austrian Association for Gynecologic Oncology (AGO). Ann. Oncol. 2016, 27, 1740–1746. [Google Scholar] [CrossRef]
- Spencer, M.E.; Jain, A.; Matteini, A.; Beamer, B.A.; Wang, N.Y.; Leng, S.X.; Punjabi, N.M.; Walston, J.D.; Fedarko, N.S. Serum levels of the immune activation marker neopterin change with age and gender and are modified by race, BMI, and percentage of body fat. J. Gerontol. A Biol. Sci. Med. Sci. 2010, 65, 858–865. [Google Scholar] [CrossRef] [Green Version]
- Sarkar, A.; Wintrode, P.L. Effects of glycosylation on the stability and flexibility of a metastable protein: The human serpin α(1)-antitrypsin. Int. J. Mass Spectrom. 2011, 302, 69–75. [Google Scholar] [CrossRef] [Green Version]
- Duprez, D.A.; Jacobs, D.R., Jr. GlycA, a composite low-grade inflammatory marker, predicts mortality: Prime time for utilization? J. Intern. Med. 2019, 286, 610–612. [Google Scholar] [CrossRef]
- Bartlett, D.B.; Slentz, C.A.; Connelly, M.A.; Piner, L.W.; Willis, L.H.; Bateman, L.A.; Granville, E.O.; Bales, C.W.; Huffman, K.M.; Kraus, W.E. Association of the Composite Inflammatory Biomarker GlycA, with Exercise-Induced Changes in Body Habitus in Men and Women with Prediabetes. Oxid. Med. Cell. Longev. 2017, 2017, 5608287. [Google Scholar] [CrossRef] [PubMed] [Green Version]
- Holzer, M.; Kern, S.; Trieb, M.; Trakaki, A.; Marsche, G. HDL structure and function is profoundly affected when stored frozen in the absence of cryoprotectants. J. Lipid Res. 2017, 58, 2220–2228. [Google Scholar] [CrossRef] [Green Version]
- Guirgis, F.A.-O.; Dodani, S.; Leeuwenburgh, C.; Moldawer, L.; Bowman, J.; Kalynych, C.; Grijalva, V.; Reddy, S.T.; Jones, A.E.; Morre, F.A. HDL inflammatory index correlates with and predicts severity of organ failure in patients with sepsis and septic shock. PLoS ONE 2018, 14, e0203813. [Google Scholar] [CrossRef]
- Kalantar-Zadeh, K.; Kopple, J.D.; Kamranpour, N.; Fogelman, A.M.; Navab, M. HDL-inflammatory index correlates with poor outcome in hemodialysis patients. Kidney Int. 2007, 72, 1149–1156. [Google Scholar] [CrossRef] [Green Version]
- Morgantini, C.; Natali, A.; Boldrini, B.; Imaizumi, S.; Navab, M.; Fogelman, A.; Ferrannini, E.; Reddy, S. Anti-inflammatory and Antioxidant Properties of HDLs Are Impaired in Type 2 Diabetes. Diabetes 2011, 60, 2617–2623. [Google Scholar] [CrossRef] [Green Version]
- Namazi, N.; Larijani, B.; Azadbakht, L. Dietary Inflammatory Index and its association with the risk of cardiovascular diseases, metabolic syndrome, and mortality: A systematic review and meta-analysis. Horm. Metab. Res. 2018, 50, 345–358. [Google Scholar] [CrossRef] [PubMed]
- Varkaneh, K.H.; Fatahi, S.; Tajik, S.; Rahmani, J.; Zarezadeh, M.; Shab Bidar, S. Dietary inflammatory index in relation to obesity and body mass index: A meta-analysis. Nutr. Food Sci. 2017, 48, 702–721. [Google Scholar] [CrossRef]
- Namazi, N.; Larijani, B.; Azadbakht, L. Association between the dietary inflammatory index and the incidence of cancer: A systematic review and meta-analysis of prospective studies. Public Health 2018, 164, 148–156. [Google Scholar] [CrossRef]
- Wood, B.L.; Andrews, J.; Miller, S.; Sabath, D.E. Refrigerated storage improves the stability of the complete blood cell count and automated differential. Am. J. Clin. Pathol. 1999, 112, 687–695. [Google Scholar] [CrossRef] [Green Version]
- Riley, L.K.; Rupert, J. Evaluation of Patients with Leukocytosis. Am. Fam. Physician 2015, 92, 1004–1011. [Google Scholar]
- Valent, P.; Klion, A.D.; Horny, H.P.; Roufosse, F.; Gotlib, J.; Weller, P.F.; Hellmann, A.; Metzgeroth, G.; Leiferman, K.M.; Arock, M.; et al. Contemporary consensus proposal on criteria and classification of eosinophilic disorders and related syndromes. J. Allergy Clin. Immunol. 2012, 130, 607–612.e609. [Google Scholar] [CrossRef] [PubMed] [Green Version]
- Abidi, K.; Khoudri, I.; Belayachi, J.; Madani, N.; Zekraoui, A.; Zeggwagh, A.A.; Abouqal, R. Eosinopenia is a reliable marker of sepsis on admission to medical intensive care units. Crit. Care 2008, 12, R59. [Google Scholar] [CrossRef] [Green Version]
- Valent, P.; Gleich, G.J.; Reiter, A.; Roufosse, F.; Weller, P.F.; Hellmann, A.; Metzgeroth, G.; Leiferman, K.M.; Arock, M.; Sotlar, K.; et al. Pathogenesis and classification of eosinophil disorders: A review of recent developments in the field. Expert Rev. Hematol. 2012, 5, 157–176. [Google Scholar] [CrossRef] [PubMed] [Green Version]
- Stone, K.D.; Prussin, C.; Metcalfe, D.D. IgE, mast cells, basophils, and eosinophils. J. Allergy Clin. Immunol. 2010, 125, S73–S80. [Google Scholar] [CrossRef]
- Nadimi, A.E.; Ahmadi, J.; Mehrabian, M. Peripheral eosinophil count and allergy in patients with coronary artery disease. Acta Med. Indones. 2008, 40, 74–77. [Google Scholar] [PubMed]
- Fest, J.; Ruiter, T.R.; Groot Koerkamp, B.; Rizopoulos, D.; Ikram, M.A.; van Eijck, C.H.J.; Stricker, B.H. The neutrophil-to-lymphocyte ratio is associated with mortality in the general population: The Rotterdam Study. Eur. J. Epidemiol. 2019, 34, 463–470. [Google Scholar] [CrossRef] [Green Version]
- Colley, C.M.; Fleck, A.; Goode, A.W.; Muller, B.R.; Myers, M.A. Early time course of the acute phase protein response in man. J. Clin. Pathol. 1983, 36, 203–207. [Google Scholar] [CrossRef] [Green Version]
- Whiteside, T.L. Cytokines and cytokine measurements in a clinical laboratory. Clin. Diagn. Lab. Immunol. 1994, 1, 257–260. [Google Scholar] [CrossRef] [PubMed]
- Thavasu, P.W.; Longhurst, S.; Joel, S.P.; Slevin, M.L.; Balkwill, F.R. Measuring cytokine levels in blood: Importance of anticoagulants, processing, and storage conditions. J. Immunol. Methods 1992, 153, 115–124. [Google Scholar] [CrossRef]
- Huang, X.; Qin, S.; Liu, Y.; Tao, L.; Jiang, H. Associations of tumor necrosis factor-α polymorphisms with the risk of colorectal cancer: A meta-analysis. BioSci. Rep. 2019, 39, BSR20181750. [Google Scholar] [CrossRef] [PubMed] [Green Version]
- Silva, L.B.; Neto, A.P.D.S.; Maia, S.M.A.S.; Guimarães, C.d.S.; Quidute, I.L.; Carvalho, A.; Júnior, S.A.; Leão, J.C. The role of TNF-alpha as a proinflammatory cytokine in pathological processes. Open Dent. J. 2019, 13, 332–338. [Google Scholar] [CrossRef]
- Fuchs, D.; Stahl-Hennig, C.; Gruber, A.; Murr, C.; Hunsmann, G.; Wachter, H. Neopterin--its clinical use in urinalysis. Kidney Int. Suppl. 1994, 47, S8–S11. [Google Scholar] [PubMed]
- Gieseg, S.P.; Baxter-Parker, G.; Lindsay, A. Neopterin, Inflammation, and Oxidative Stress: What Could We Be Missing? Antioxidants 2018, 7, 80. [Google Scholar] [CrossRef] [Green Version]
- Chang, H.H.; Wang, T.Y.; Lee, I.H.; Lee, S.Y.; Chen, K.C.; Huang, S.Y.; Yang, Y.K.; Lu, R.B.; Chen, P.S. C-reactive protein: A differential biomarker for major depressive disorder and bipolar II disorder. World J. Biol. Psychiatry 2017, 18, 63–70. [Google Scholar] [CrossRef]
- Raison, C.L.; Pikalov, A.; Siu, C.; Tsai, J.; Koblan, K.; Loebel, A. C-reactive protein and response to lurasidone in patients with bipolar depression. Brain Behav. Immun. 2018, 73, 717–724. [Google Scholar] [CrossRef]
- Zakynthinos, E.; Pappa, N. Inflammatory biomarkers in coronary artery disease. J. Cardiol. 2009, 53, 317–333. [Google Scholar] [CrossRef] [Green Version]
- Inaba, T.; Nomura, N.; Ishizuka, K.; Yoshioka, K.; Takahashi, M.; Yuasa, S.; Saito, K.; Fujitomo, Y.; Nakanishi, M.; Fujita, N. Basic evaluation of Pentra MS CRP, a new automated hematology analyzer for rapid 5-part WBC differential and CRP using a small volume of whole blood. Int. J. Lab. Hematol. 2015, 37, 208–216. [Google Scholar] [CrossRef] [PubMed]
- Mozes, G.; Friedman, N.; Shainkin-Kestenbaum, R. Serum amyloid A: An extremely sensitive marker for intensity of tissue damage in trauma patients and indicator of acute response in various diseases. J. Trauma. 1989, 29, 71–74. [Google Scholar] [CrossRef]
- Marchand, A.; Galen, R.S.; Van Lente, F. The predictive value of serum haptoglobin in hemolytic disease. JAMA 1980, 243, 1909–1911. [Google Scholar] [CrossRef] [PubMed]
- Haas, B.; Serchi, T.; Wagner, D.R.; Gilson, G.; Planchon, S.; Renaut, J.; Hoffmann, L.; Bohn, T.; Devaux, Y. Proteomic analysis of plasma samples from patients with acute myocardial infarction identifies haptoglobin as a potential prognostic biomarker. J. Proteom. 2011, 75, 229–236. [Google Scholar] [CrossRef]
- Elson, E.C. Quantitative determination of serum haptoglobin. A simple and rapid method. Am. J. Clin. Pathol. 1974, 62, 655–663. [Google Scholar] [CrossRef]
- Garcia-Laorden, M.I.; Sole-Violan, J.; Rodriguez de Castro, F.; Aspa, J.; Briones, M.L.; Garcia-Saavedra, A.; Rajas, O.; Blanquer, J.; Caballero-Hidalgo, A.; Marcos-Ramos, J.A.; et al. Mannose-binding lectin and mannose-binding lectin-associated serine protease 2 in susceptibility, severity, and outcome of pneumonia in adults. J. Allergy Clin. Immunol. 2008, 122. [Google Scholar] [CrossRef]
- Panda, A.K.; Parida, J.R.; Tripathy, R.; Pattanaik, S.S.; Ravindran, B.; Das, B.K. Mannose binding lectin: A biomarker of systemic lupus erythematosus disease activity. Arthritis Res. Ther. 2012, 14, R218. [Google Scholar] [CrossRef] [Green Version]
- Mandal, J.; Malla, B.; Steffensen, R.; Costa, L.; Egli, A.; Trendelenburg, M.; Blasi, F.; Kostikas, K.; Welte, T.; Torres, A.; et al. Mannose-binding lectin protein and its association to clinical outcomes in COPD: A longitudinal study. Respir. Res. 2015, 16, 150. [Google Scholar] [CrossRef] [PubMed] [Green Version]
- Zhang, J.; Zhang, R.; Wang, Y.; Li, H.; Han, Q.; Wu, Y.; Wang, T.; Liu, F. The level of serum albumin is associated with renal prognosis in patients with diabetic nephropathy. J. Diab. Res. 2019, 2019, 7825804. [Google Scholar] [CrossRef] [Green Version]
- Jensen, K.B.; Jarnum, S. Albumin and IgG turnover in ulcerative colitis and Crohn’s disease. In Plasma Protein Turnover; Bianchi, R.M.G., McFarlane, A.S., Eds.; Palgrave Macmillan: London, UK, 1976. [Google Scholar]
- Keller, U. Nutritional Laboratory Markers in Malnutrition. J. Clin. Med. 2019, 8, 775. [Google Scholar] [CrossRef] [Green Version]
- Hrnciarikova, D.; Juraskova, B.; Hyspler, R.; Solichová, D.; Ticha, A.; Klemera, P.; Hronek, M.; Zadak, Z. A changed view of serum prealbumin in the elderly: Prealbumin values influenced by concomitant inflammation. Biomed. Pap. Med. Fac. Univ. Palacky Olomouc. Czech. Repub 2008, 151, 273–276. [Google Scholar] [CrossRef] [PubMed]
- Wang, W.; Pan, Y.; Tang, X.; Hao, G.; Xie, Y.; Ma, S.; Luo, J.; Guo, D.; Ding, F. Serum prealbumin and its changes over time are associated with mortality in acute kidney injury. Sci. Rep. 2017, 7, 41493. [Google Scholar] [CrossRef] [Green Version]
- Chapman, D.P.; Gooding, K.M.; McDonald, T.J.; Shore, A.C. Stability of urinary albumin and creatinine after 12 months storage at −20 °C and −80 °C. Pract Lab. Med. 2019, 15, e00120. [Google Scholar] [CrossRef]
- Matusiewicz, M.; Neubauer, K.; Lewandowska, P.; Gamian, A.; Krzystek-Korpacka, M. Reduced transferrin levels in active inflammatory bowel disease. BioMed Res. Int. 2017, 2017, 9541370. [Google Scholar] [CrossRef] [PubMed] [Green Version]
- Terzić, B.; Stanojevic, I.; Radojicic, Z.; Resan, M.; Petrovic, D.; Maksic, D.; Djekic, J.; Ristic, P.; Petrović, M.; Mijusković, M. Urinary transferrin as an early biomarker of diabetic nephropathy. Vojnosanit. Pregl. 2017, 76, 138. [Google Scholar] [CrossRef]
- Maruna, P.; Nedelníková, K.; Gürlich, R. Physiology and genetics of procalcitonin. Physiol. Res. 2000, 49, S57–S61. [Google Scholar] [PubMed]
- El Kassas, G.M.; Shehata, M.A.; El Wakeel, M.A.; Amer, A.F.; Elzaree, F.A.; Darwish, M.K.; Amer, M.F. Role of procalcitonin as an inflammatory marker in a sample of Egyptian children with simple obesity. Open Access Maced. J. Med. Sci. 2018, 6, 1349–1353. [Google Scholar] [CrossRef] [PubMed] [Green Version]
- Stevens, M.K.; Yaksh, T.L. Time course of release in vivo of PGE2, PGF2α, 6-Keto-PGF1α, and TxB2 into the brain extracellular space after 15 min of complete global ischemia in the presence and absence of cyclooxygenase inhibition. J. Cerebr. Blood Flow Metab. 1988, 8, 790–798. [Google Scholar] [CrossRef] [Green Version]
- Brose, S.A.; Thuen, B.T.; Golovko, M.Y. LC/MS/MS method for analysis of E₂ series prostaglandins and isoprostanes. J. Lipid Res. 2011, 52, 850–859. [Google Scholar] [CrossRef] [Green Version]
- Connors, K.A.; Amidon, G.L.; Stella, V.J. Chemical Stability of Pharmaceuticals: A Handbook for Pharmacists; Wiley: Hoboken, NJ, USA, 1979. [Google Scholar]
- Goncharov, N.V.; Nadeev, A.D.; Jenkins, R.O.; Avdonin, P.V. Markers and Biomarkers of Endothelium: When Something Is Rotten in the State. Oxid. Med. Cell. Longev. 2017, 2017, 9759735. [Google Scholar] [CrossRef] [PubMed]
- Liu, A.; Wan, A.; Feng, A.; Rui, R.; Zhou, B. ICAM-1 gene rs5498 polymorphism decreases the risk of coronary artery disease. Medicine 2018, 97, e12523. [Google Scholar] [CrossRef]
- Chen, Q.; Appenheimer, M.M.; Muhitch, J.B.; Fisher, D.T.; Clancy, K.A.; Miecznikowski, J.C.; Wang, W.C.; Evans, S.S. Thermal facilitation of lymphocyte trafficking involves temporal induction of intravascular ICAM-1. Microcirculation 2009, 16, 143–158. [Google Scholar] [CrossRef]
- Okugawa, Y.; Miki, C.; Toiyama, Y.; Koike, Y.; Yokoe, T.; Saigusa, S.; Tanaka, K.; Inoue, Y.; Kusunoki, M. Soluble VCAM-1 and its relation to disease progression in colorectal carcinoma. Exp. Ther. Med. 2010, 1, 463–469. [Google Scholar] [CrossRef]
- Kong, D.H.; Kim, Y.K.; Kim, M.R.; Jang, J.H.; Lee, S. Emerging Roles of Vascular Cell Adhesion Molecule-1 (VCAM-1) in Immunological Disorders and Cancer. Int. J. Mol. Sci. 2018, 19, 1057. [Google Scholar] [CrossRef] [Green Version]
- Müller, N. The Role of Intercellular Adhesion Molecule-1 in the Pathogenesis of Psychiatric Disorders. Front. Pharmacol. 2019, 10, 1251. [Google Scholar] [CrossRef]
- Kraus, J.; Gerriets, T.; Leis, S.; Stolz, E.; Oschmann, P.; Heckmann, J.G. Time course of VCAM-1 and ICAM-1 in CSF in patients with basal ganglia haemorrhage. Acta Neurol. Scand. 2007, 116, 49–55. [Google Scholar] [CrossRef]
- Liu, Z.C.; Meng, L.Q.; Song, J.H.; Gao, J. Dynamic protein expression of NF-κB following rat intracerebral hemorrhage and its association with apoptosis. Exp. Ther. Med. 2018, 16, 3903–3908. [Google Scholar] [CrossRef] [Green Version]
- Kaulmann, A.; Legay, S.; Schneider, Y.-J.; Hoffmann, L.; Bohn, T. Inflammation related responses of intestinal cells to plum and cabbage digesta with differential carotenoid and polyphenol profiles following simulated gastro-intestinal digestion. Mol. Nutr. Food Res. 2016, 60, 992–1005. [Google Scholar] [CrossRef] [PubMed]
- Shoelson, S.E.; Lee, J.; Yuan, M. Inflammation and the IKKβ/IκB/NF-κB axis in obesity- and diet-induced insulin resistance. Int. J. Obes. Rel. Dis. 2004, 27, S49–S52. [Google Scholar] [CrossRef] [PubMed] [Green Version]
- Tanaka, A.; Zhou, Y.; Ogawa, M.; Shia, J.; Klimstra, D.S.; Wang, J.Y.; Roehrl, M.H. STAT1 as a potential prognosis marker for poor outcomes of early stage colorectal cancer with microsatellite instability. PLoS ONE 2020, 15, e0229252. [Google Scholar]
- Cox, A.; Chernis, N.; Bader, D.; Saha, P.; Masschelin, P.; Felix, J.; Lian, Z.; Putluri, V.; Rajapakshe, K.; Kim, K.; et al. STAT1 dissociates adipose tissue inflammation from insulin sensitivity in obesity. Diabetes 2020, 69, 2630–2641. [Google Scholar] [CrossRef]
- Nguyen, P.M.; Putoczki, T.L.; Ernst, M. STAT3-Activating Cytokines: A Therapeutic Opportunity for Inflammatory Bowel Disease? J. Interferon Cytokine Res. 2015, 35, 340–350. [Google Scholar] [CrossRef] [PubMed] [Green Version]
- Stienstra, R.; Duval, C.; Müller, M.; Kersten, S. PPARs, Obesity, and Inflammation. PPAR Res. 2007, 2007, 95974. [Google Scholar] [CrossRef] [Green Version]
- Fuentes, E.; Guzmán-Jofre, L.; Moore-Carrasco, R.; Palomo, I. Role of PPARs in inflammatory processes associated with metabolic syndrome (Review). Mol. Med. Rep. 2013, 8, 1611–1616. [Google Scholar] [CrossRef] [Green Version]
- Michalik, L.; Wahli, W. PPARs Mediate Lipid Signaling in Inflammation and Cancer. PPAR Res. 2008, 2008, 134059. [Google Scholar] [CrossRef] [PubMed] [Green Version]
- Kaminska, B.; Gozdz, A.; Zawadzka, M.; Ellert-Miklaszewska, A.; Lipko, M. MAPK signal transduction underlying brain inflammation and gliosis as therapeutic target. Anat. Rec. 2009, 292, 1902–1913. [Google Scholar] [CrossRef]
- Guirgis, F.W.; Dodani, S.; Moldawer, L.; Leeuwenburgh, C.; Bowman, J.; Kalynych, C.; Jones, A.E.; Reddy, S.T.; Moore, F.A. Exploring the Predictive Ability of Dysfunctional High-Density Lipoprotein for Adverse Outcomes in Emergency Department Patients with Sepsis: A Preliminary Investigation. Shock 2017, 48, 539. [Google Scholar] [CrossRef]
- Walker, K.A.; Hoogeveen, R.C.; Folsom, A.R.; Ballantyne, C.M.; Knopman, D.S.; Windham, B.G.; Jack, C.R., Jr.; Gottesman, R.F. Midlife systemic inflammatory markers are associated with late-life brain volume: The ARIC study. Neurology 2017, 89, 2262–2270. [Google Scholar] [CrossRef] [PubMed]
- Bonaccio, M.; Di Castelnuovo, A.; Pounis, G.; De Curtis, A.; Costanzo, S.; Persichillo, M.; Cerletti, C.; Donati, M.B.; de Gaetano, G.; Iacoviello, L. A score of low-grade inflammation and risk of mortality: Prospective findings from the Moli-sani study. Haematologica 2016, 101, 1434–1441. [Google Scholar] [CrossRef] [PubMed] [Green Version]
- Connelly, M.A.; Otvos, J.D.; Shalaurova, I.; Playford, M.P.; Mehta, N.N. GlycA, a novel biomarker of systemic inflammation and cardiovascular disease risk. J. Transl. Med. 2017, 15, 219. [Google Scholar] [CrossRef]
- Chatterjee, B.P.; Mondal, G.; Chatterjee, U. Glycosylation of acute phase proteins: A promising disease biomarker. Proc. Natl. Acad. Sci. India Sect. B 2014, 84, 865–874. [Google Scholar] [CrossRef]
- Reily, C.; Stewart, T.J.; Renfrow, M.B.; Novak, J. Glycosylation in health and disease. Nat. Rev. Nephrol. 2019, 15, 346–366. [Google Scholar] [CrossRef]
- Saha, S.; Harrison, S.H.; Chen, J.Y. Dissecting the human plasma proteome and inflammatory response biomarkers. Proteomics 2009, 9, 470–484. [Google Scholar] [CrossRef]
- Wewer Albrechtsen, N.J.; Geyer, P.E.; Doll, S.; Treit, P.V.; Bojsen-Møller, K.N.; Martinussen, C.; Jørgensen, N.B.; Torekov, S.S.; Meier, F.; Niu, L.; et al. Plasma Proteome Profiling Reveals Dynamics of Inflammatory and Lipid Homeostasis Markers after Roux-En-Y Gastric Bypass Surgery. Cell Syst. 2018, 7, 601–612.e603. [Google Scholar] [CrossRef] [Green Version]
- Mun, S.; Lee, J.; Lim, M.-K.; Lee, Y.-R.; Ihm, C.; Lee, S.H.; Kang, H.-G. Development of a novel diagnostic biomarker set for rheumatoid arthritis using a proteomics approach. BioMed Res. Int. 2018, 2018, 7490723. [Google Scholar] [CrossRef] [Green Version]
- Shang, C.; Sun, W.; Wang, C.; Wang, X.; Zhu, H.; Wang, L.; Yang, H.; Wang, X.; Gong, F.; Pan, H. Comparative Proteomic Analysis of Visceral Adipose Tissue in Morbidly Obese and Normal Weight Chinese Women. Int. J. Endocrinol. 2019, 2019, 2302753. [Google Scholar] [CrossRef] [PubMed]
- Shommu, N.S.; Jenne, C.N.; Blackwood, J.; Joffe, A.R.; Martin, D.A.; Thompson, G.C.; Vogel, H.J. Metabolomic and inflammatory mediator based biomarker profiling as a potential novel method to aid pediatric appendicitis identification. PLoS ONE 2018, 13, e0193563. [Google Scholar]
- Daniluk, U.; Daniluk, J.; Kucharski, R.; Kowalczyk, T.; Pietrowska, K.; Samczuk, P.; Filimoniuk, A.; Kretowski, A.; Lebensztejn, D.; Ciborowski, M. Untargeted Metabolomics and Inflammatory Markers Profiling in Children With Crohn’s Disease and Ulcerative Colitis—A Preliminary Study. Inflamm. Bowel. Dis. 2019, 25, 1120–1128. [Google Scholar] [CrossRef]
- Pietzner, M.; Kaul, A.; Henning, A.-K.; Kastenmüller, G.; Artati, A.; Lerch, M.M.; Adamski, J.; Nauck, M.; Friedrich, N. Comprehensive metabolic profiling of chronic low-grade inflammation among generally healthy individuals. BMC Med. 2017, 15, 210. [Google Scholar] [CrossRef] [PubMed] [Green Version]
- Bauer, M.; Giamarellos-Bourboulis, E.J.; Kortgen, A.; Möller, E.; Felsmann, K.; Cavaillon, J.M.; Guntinas-Lichius, O.; Rutschmann, O.; Ruryk, A.; Kohl, M.; et al. A Transcriptomic Biomarker to Quantify Systemic Inflammation in Sepsis—A Prospective Multicenter Phase II Diagnostic Study. EBioMedicine 2016, 6, 114–125. [Google Scholar] [CrossRef] [PubMed] [Green Version]
- Cavicchia, P.P.; Steck, S.E.; Hurley, T.G.; Hussey, J.R.; Ma, Y.; Ockene, I.S.; Hébert, J.R. A new dietary inflammatory index predicts interval changes in serum high-sensitivity C-reactive protein. J. Nutr. 2009, 139, 2365–2372. [Google Scholar] [CrossRef] [PubMed]
- Shivappa, N.; Steck, S.E.; Hurley, T.G.; Hussey, J.R.; Hebert, J.R. Designing and developing a literature-derived, population-based dietary inflammatory index. Public Health Nutr. 2014, 17, 1689–1696. [Google Scholar] [CrossRef] [Green Version]
- Kaluza, J.; Harris, H.; Melhus, H.; Michaëlsson, K.; Wolk, A. Questionnaire-Based Anti-Inflammatory Diet Index as a Predictor of Low-Grade Systemic Inflammation. Antioxid. Redox Signal. 2018, 28, 78–84. [Google Scholar] [CrossRef]
- Tabung, F.K.; Smith-Warner, S.A.; Chavarro, J.E.; Wu, K.; Fuchs, C.S.; Hu, F.B.; Chan, A.T.; Willett, W.C.; Giovannucci, E.L. Development and Validation of an Empirical Dietary Inflammatory Index. J. Nutr. 2016, 146, 1560–1570. [Google Scholar] [CrossRef]
- Kaur, M.; Mehta, S. Chronic Pain Grade Questionnaire. J. Physiother. 2013, 59, 60. [Google Scholar]
- Dandana, A.; Gammoudi, I.; Ferchichi, S.; Chahed, H.; Limam, H.B.; Addad, F.; Miled, A. Correlation of oxidative stress parameters and inflammatory markers in tunisian coronary artery disease patients. Int. J. Biomed. Sci. 2011, 7, 6–13. [Google Scholar]
- Chehaibi, K.; Trabelsi, I.; Mahdouani, K.; Slimane, M.N. Correlation of Oxidative Stress Parameters and Inflammatory Markers in Ischemic Stroke Patients. J. Stroke Cereb. Dis. 2016, 25, 2585–2593. [Google Scholar] [CrossRef]
- Wojciechowska, C.; Romuk, E.; Tomasik, A.; Skrzep-Poloczek, B.; Nowalany-Kozielska, E.; Birkner, E.; Jacheć, W. Oxidative Stress Markers and C-Reactive Protein Are Related to Severity of Heart Failure in Patients with Dilated Cardiomyopathy. Mediat. Inflamm. 2014, 2014, 147040. [Google Scholar] [CrossRef] [Green Version]
- Sadowska, A.M.; van Overveld, F.J.; Górecka, D.; Zdral, A.; Filewska, M.; Demkow, U.A.; Luyten, C.; Saenen, E.; Zielinski, J.; De Backer, W.A. The interrelationship between markers of inflammation and oxidative stress in chronic obstructive pulmonary disease: Modulation by inhaled steroids and antioxidant. Respir. Med. 2005, 99, 241–249. [Google Scholar] [CrossRef] [Green Version]
- Il’yasova, D.; Ivanova, A.; Morrow, J.D.; Cesari, M.; Pahor, M. Correlation between two markers of inflammation, serum C-reactive protein and interleukin 6, and indices of oxidative stress in patients with high risk of cardiovascular disease. Biomarkers 2008, 13, 41–51. [Google Scholar] [CrossRef] [PubMed]
- Zhou, Y.; Zhao, M.; Pu, Z.; Xu, G.; Li, X. Relationship between oxidative stress and inflammation in hyperuricemia: Analysis based on asymptomatic young patients with primary hyperuricemia. Medicine 2018, 97, e13108. [Google Scholar] [CrossRef]
- Nagato, A.C.; Bezerra, F.S.; Lanzetti, M.; Lopes, A.A.; Silva, M.A.; Porto, L.C.; Valença, S.S. Time course of inflammation, oxidative stress and tissue damage induced by hyperoxia in mouse lungs. Int. J. Exp. Pathol. 2012, 93, 269–278. [Google Scholar] [CrossRef] [PubMed]
- Schlorff, E.C.; Husain, K.; Somani, S.M. Dose- and time-dependent effects of ethanol on plasma antioxidant system in rat. Alcohol 1999, 17, 97–105. [Google Scholar] [CrossRef]


| Marker | Class of Marker | Measured in: Matrix | Stability | Techniques Used | Relevance for Chronic Diseases | Comment, Advantage/Disadvantage |
|---|---|---|---|---|---|---|
| EPR | Original ROS and RNS measurements | Whole blood, cells, cellular compartments | Very limited, fresh samples must be used | EPR spectroscopy, spin probe needs to be added to stabilize electron spins | Proposed and used in some neurological disease such as human prion diseases [151]. In small-scale study with 100 middle-aged subjects, capillary blood was measured by EPR. ROS increased with age, EPR measures were well correlated with PCs and TBARS [152]. | Measures cause and original OS species, techniques rarely available |
| 8-OH-dhG | RNA/DNA oxidative breakdown products | Urine, plasma/ serum | 2 y at −80 °C [19] | ELISA, chromatography | Meta-analysis related 8-OH-dhG with CVD [18] and solid tumors [153]. | Not recommended by EFSA alone but as support measure [150] |
| DNA double strand break, COMET assay | DNA oxidative breakdown | Viable cells, e.g., leukocytes | Fine as long as cells can be kept viable or fresh samples are used | Electrophoresis with fluorescence microscopy. Modifications with endonuclease III treatment for damaged pyrimidine base detection and formamidopyrimidine DNA glycosylase for purine bases |
Higher level of DNA damage in smokers vs. non-smokers in meta-analysis of 38 studies (SMD = 0.55 [154]). Increased short-term DNA damage after exercise in a meta-analysis with 35 studies [155]. | Modified method accepted by EFSA [150] |
| MDA | Lipid oxidation product | Plasma/ serum | <3 weeks at −20 °C [156]. Doubling of concentration when stored on ice for 36 h | Spectrophotometrically, chromatography | Meta-analysis showed MDA elevation in patients with PD [17], AMD [157], and COPD [158]. In T2D subjects receiving vitamin C or E, TBARS/MDA was sign. reduced in plasma [159]. | Not recognized by EFSA [150] |
| F2-isoprostanes | Lipid oxidation product | Plasma/serum or urine | 6 months at −80 °C (plasma), changes with freezing/thawing cycles [160,161] | GC-MS, LC-MS, ELISA. ELISA yielding often >50% higher levels due to cross-reactivity [162]. Urine levels 20–100 times higher than plasma; total F2-isoP or esterified ones are superior to free F2-isoP as the latter can be formed independently from ox. stress [163]. | Meta-analysis found strong increases of F2-isoprostanes for respiratory and kidney diseases, weaker ones for metS, smoking, and hypertension [163]. Relations in meta-analyses between cardiac arrest and F2-isoprostanes [164], positive airway pressure treatment in subjects with sleep apnoea [165] and depression [166]. | Recognized by EFSA if detected by MS-MS [150] |
| Phosphatidyl-choline hydroperoxides (PCOOH) | Lipid peroxidation | Plasma/serum | Sample stability (plasma) at −78 °C was reported, but increased levels at 4 °C and −20 °C [167] | LC-CL or LC-MS. | Increased PCOOH concentrations with ageing [168] and in dialysis patients with diabetic nephropathy [169]. | Recognized by EFSA [150] |
| oxLDL | Lipid oxidation | Plasma/serum | Whole blood samples 36 h on ice [170]. For plasma, several months at -20 °C [171], anti-freezing recommended | Antibodies | Meta analyses showing positive association between oxLDL and atherosclerotic CVD [23], sleep apnoea [172], and reducing oxLDL by olive oil [173], systematic review of oxLDL Ab and CAD. | Recognized by EFSA [150] |
| AOPPs | Protein oxidation, often of albumin | Plasma/serum | At least 6 months at −20 °C [174] | Commercial colorimetric assays | Relation to coronary syndrome [175], Crohn’s disease [176], diabetes [177]. | Results from small and medium-scale studies |
| Protein carbonyls (PCs, subgroup of AOPPs) | Protein oxidation | Plasma/serum | At least 1 month at −80 °C [178] | Spectrophotometry, antibodies, or MS/proteomics, mostly following derivatization with DNP [179] | Small-scale clinical studies relating PCs to Alzheimers disease [180] and T2D treatment [181], among others. | Only results from small-scale disease related studies |
| Nitrated albumin | Protein oxidation | Plasma/serum | Nitrated proteomics standard UPS1 stable for 9 months at −20 °C | Nitrated albumin | Protein oxidation. | Plasma/serum |
| γH2AX | Histone modification | In cells (leukocytes etc.) | Unknown | Immunological (ELISA), combined with e.g., flow-cytometry | Mostly been used as a biomarker for cancer [182,183]. | Unknown if suitable marker of ox. stress, rather marker of apoptosis [184] |
| GPx, SOD, CAT | Antioxidant enzymes | Serum (SOD3, GPX3), erythrocytes (CAT) | Stable when stored on ice for 48 h [185] or frozen at −80 °C for 21 months [185] | Spectrophotometrically | Lower levels of SOD, CAT and GPx in meta-analysis with subjects with CHD [186] and with PD [187]. Not recognized by EFSA [150]. | Marker of antioxidants, not necessarily pro-oxidants. |
| Total antioxidant capacity | Antioxidant capacity | Serum, plasma | Depending on stability of plasma constituents albumin, phenolics, uric acid, tocopherols etc. Likely several months at −80 °C | Spectrophotometric | Sign. lower RR for all-cause mortality for subjects with higher FRAP and TRAP status, though only based on 3 and 2 observational studies, resp. [188]. In hemodialysis patients, sign. lower antiox. Capacity found vs. healthy controls [189]. In T2D subjects, those with more complications showed higher levels of TAC (determined by FRAP, [190]). | Only marker of antioxidants, not necessarily pro-oxidants |
| Nrf2 | Antioxidant transcription factor | Leukocytes, tissue | Possibly several months at −80 °C (protein extract), [191] | Transcriptomics, immunologic (ELISA), preferably in nuclear fraction | High expression of Nrft in meta-analysis (17 studies) of patients with solid tumors [192]. Overexpression of Nrf2 in meta-analysis of AD and PD, though ARE related genes (n = 31) were down-regulated, likely due to MAFF overexpression [193]. | Difficult to interpret data, time and tissue dependency of measures, requiring isolation of nuclear fraction |
| Index—thiol ratio | Index—antioxidant/oxidant ratio test | Plasma, serum | At least 6 months at −80 °C [194] | Spectrophotometric | Increased ratio of disulfide to native thiols related to CVD [195], respiratory diseases and metabolic disorders, [27], as well as cancer, ageing, and neurodegenerative diseases [196], and obesity [197]. | Interesting marker and physiologically meaningful, lack of data |
| Index—GSH:GSSG ratio | Index—antioxidant/oxidant ratio test | Intracellular fractions | Unclear, challenge to isolate fraction as very unstable [198] | Spectrophotometric (commercial assays available) | No meta-analysis. Clinical studies employing GSH:GSSG ratio reviewed earlier [27], listing 2 dozen individual studies, mostly small-scale. Some studies reporting on blood pressure, virus-related respiratory problems, mercury exposure and overweight etc. were related to a higher oxidized ratio of GSH:GSSG. | Delicate marker as analytically challenging |
| DAQS (Dietary Antioxidant Quality Score) | Dietary index | Diet | Calculates sum of antioxidants, creates a score, considering recommended intakes. Includes vitamin A, C, E; Se, Mn and Zn | FFQ | Employed in women, finding a significant relation between higher antioxidant intake and higher bone-mineral density [199]. A modified version, assigning scores of 0 or 1 for food items was developed [200], and a significant interaction with polymorphisms of gene region on chromosome 6P21 was found. | Only including dietary aspects, not further host-factors. Disregards secondary plant compounds |
| CDAI (Composite Dietary Antioxidant Index) | Dietary index | Diet | Ranks antiox. intake vs. population norms. Included also vitamins A, C, E, and minerals Se, Mn, Zn | FFQ | Original approach by Wright et al. included carotenoids, flavonoids, vitamin E, C and Se, i.e., also phytochemicals [201]. In their study, a higher index was related to lower lung cancer risk. | Only including dietary aspects, not further host-factors |
| Marker | Class of Marker | Measured in: Matrix | Stability | Techniques Used | Relevance for Chronic Diseases | Comments, Advantages/Disadvantages |
|---|---|---|---|---|---|---|
| Cytokines: IL1β, IL-6, IL-8, IFγ, TNF-α, | Pro-inflammatory cytokines | Plasma, serum, or expression of mRNA in tissue | Stable for 3 freeze-thaw cycles reported for IL-6, IL-10, IFNγ, and IL-2 [309]. Stable during 1 y at −80 °C (IL-1β, IFγ, IL-6, TNF-α) [310] | ELISA, multiplex bead array assays [311], mRNA levels by PCR | IL-6: In meta-analyses related to cognitive decline in elderly without dementia [312], more severe COVID-19 complications [313], IBS [314], polymorphisms of IL-6 related to lower risk of obesity [315]. | Primary markers of inflammation, low half-lives in blood (minutes) |
| IL-8: Meta-analyses shown relations between elevated IL-8 and lupus erythematodes [316], hepato-cellular carcinoma [317], periodontitis [318], but not obesity [319]. | ||||||
| IFγ: Polymorphisms related in meta-analysis of 9 case-control studies to breast cancer [320], in a meta-analysis of 8 studies on cervical cancer [321]. No sign. association with mycoplasma caused pneumonia in meta-analysis of 6 small-medium scale studies [322]. | ||||||
| TNF-α: higher circulating conc. in individuals with obesity [323]. Meta-analysis of 5 prospective studies failed to show relation with T2D RR, unlike IL-6 and CRP [324]. Increased TNF-α (and IL-6 and 8) in breast-cancer based on meta-analysis [325]. | ||||||
| Leukocyte count | Cell counting | Whole blood | Cell counting should be done on fresh whole blood samples, within 3 h [326]. Freezing for 15 d at −70 °C resulted in sign. changes in cell counts [327] | In clinic, several automated systems, including impedance and optical systems, as well as image cytometers [328] | Increased leukocyte count (>11 × 109/L) associated with worse outcome in stable CAD and even in the general population [329], in a meta-analysis related with MetS [330] and also with T2D [331]. | Interesting proxy-marker of inflammation, as leukocytes are major secreters of cytokines |
| Lymphocyte count | Low lymphocyte count found in meta-analyses of COVID-19 [332], also used in HIV as decision-helper for starting anti-viral therapy [333]. | |||||
| Eosiniphil counts | Normally <0.5 × 10⁹ cells/L. Eosinophils increased in allergic diseases, e.g., asthma as shown in a meta-analysis [334] and also in autoimmune diseases, such as celiac disease [335], and in IBD (both CD and UC) [336]. Elevated also in Hodgkin’s lymphoma [337]. | |||||
| Monocyte counts | Monocytosis indicated by >0.8 × 10⁹/L in adults. Frequently associated with infections, e.g., malaria [338], autoimmune diseases such as rheumatoid arthritis [339], IBD (1020), colorectal cancer as shown in a meta-analysis [340], obesity [341], and schizophrenia as seen in a meta-analysis [342]; no elevation found in meta-analysis of T2D [331]. | |||||
| Basolphil counts | Number normally <0.20 × 10⁹/L [343]. Elevated level (>2.0 × 10⁹/L) associated with autoimmune inflammation and allergies [344]. Low level of basophils associated with rheumatoid arthritis [345]. | |||||
| Neutrophil-lymphocyte ratio (NLR) | High NLR reported for poor glycemic control in T2D [346]. Multiple studies showed that increased NLR was associated with poor prognosis in a variety of cancers, such as colon, pancreatic, stomach, and lung cancer. In meta-analysis of >100 studies and 40,000 patients, an NLR >4 was associated with worse solid tumor survival rates [347]. | |||||
| Lymphocyte –monocyte ratio (LMR) | LMR associated with stroke severity and poor outcome, also according to meta-analysis [348]. Low LMR was sign. associated in a meta-analysis with lower overall survival in patients with ovarian cancer [349] and with solid tumors due to meta-analysis of 29 studies [350]. | |||||
| SII | In meta-analysis of 22 articles and >7500 patients, SII proposed as good predictor for tumor progression and survival in several cancers [351]. | |||||
| CRP | Acute phase proteins/reactants | Blood, CRF, | 11 y at −80 °C [352] | ELISA and other immune-techniques [353] | Meta-analyses showed higher levels in blood of PD [354], CHD and stroke mortality [355]. Increased tyrosine-nitrated levels in subjects with CAD [356] and with hemodialysis vs. controls [357]. | Very frequently used marker |
| SAA | Serum, plasma | At least 17 d at −20 °C [358], no report on storability at −80 °C | In clinical practice automated latex agglutination immunoassay [359] | Strong relation between elevated SAA and obesity [14], coronary heart disease [15], poor overall survival in individuals with solid tumors [360] and worse outcomes in lung cancer [361] in meta-analysis. | Very frequently used marker | |
| Haptoglobin | Serum, plasma | Stability of haptoglobin in bovine plasma at least 3 weeks at −20 °C and −80 °C [362] and 120 d in saliva at −20 °C [363] | Nephelometric methods in plasma on different automated laboratory systems [364], spectrophotometry, immunological methods, gel electrophorosis | In a recent meta-analysis, the haptoglobin genotype was associated with cardiovascular outcomes [365]. Haptoglobin also increases in inflammatory diseases, in cigarette smokers, during nephrotic syndrome [366] and in rheumatoid arthritis [367] | Interesting though less frequently employed marker | |
| Mannose-binding lectin (MBL) | Serum, plasma | Pure protein can be stored for 1 y at −80 °C [368], no data on plasma. | ELISA | In meta-analysis of MBL and polymorphisms, significant associations were found to sepsis [369], and vulvovaginal infections [370], but not to hepatitis B infection risk (though severity) [371] | Interesting but less frequently employed marker | |
| Acute phase reactant -procalcitonin | Serum, plasma | Small losses of 10% with several year storage at −80 °C [372] | ELISA | Meta-analysis of pneumonia [373] did not suggest that marker was useful to differentiate between viral and bacterial diseases, while it allowed to differentiate in another meta-analysis between infection and IBD [374] | Marker of bacterial, not viral infection or general inflammation marker | |
| ICAM-1, VCAM-1 | Endothelial marker | Soluble forms in serum, plasma | Some months in lyophilized form in kits at −20 °C, no published data on stability in samples | ELISA | In meta-analysis of 15 prospective studies with T2D, increased ICAM-1 but not VCAM-1 related to higher risk of T2D [375]. In meta-analysis of 18 case-control studies of cancer risk, ICAM-1 polymorphism was related to cancer risk [376], similar to meta-analysis of 12 case-control studies on T2D [377] and CHD in meta-analysis of 11 case-control studies [378].VCAM-1, but not ICAM-1 associated with preeclampsia in a meta-analysis of 21 studies [379]. | Marker of endothelial health, rather not general inflammation |
| PGE2 | COX-2 related marker | Serum, plasma | Unclear, but likely short, even at −80 °C | ELISA, mRNA measurement, MS-MS. | Elevated PGE2 levels in women with obesity [380], cancer, including colorectal cancer [381] and ovarian cancer [382], T2D patients [383], contribution to neurological disorders assumed [384]. | As stimulated by cytokines interesting marker of systemic inflammation |
| NF-κB | Pro-inflammatory transcription factor | Leukocytes, body tissue | 2 months at −80 °C in isolated protein extract [385] | ELISA, transcriptomics. Extraction of nuclear fraction advised. | In meta-analysis, increased expression of NF-kB in individuals with worse solid tumor outcomes [25], both in cytosol and nucleus. Increased expression in meta-analysis of non-small cell lung cancer [386], but only when determined in nuclear fraction. Isolated mycocytes from subjects with obesity showed elevated NF-kB expression [387]. | Difficult to interpret, time and tissue dependency of measures |
| Neopterin | Macrophage product | Plasma, urine | 3 d at RT, 3 months at −20 °C [111] | Fluorescence, HPLC, ELISA | Plasma levels were related to homocysteine and risk of CVD [388], and as well as to cancer such as oviaran cancer [389]. It was also shown to be modulated by age, gender, and BMI [390]. | Rather marker of immune cell activation |
| GlycA | Composite marker of glycosylation | Plasma, serum | Unclear, glycosy-lation increases protein stability [391], some months at −80 °C assumed | NMR | Strong relation to total mortality and cancer mortality [392], exercise and visceral fat [393] | Promising novel marker, expensive equipment needed (NMR) |
| HDL inflammatory marker (HII) | Lipoprotein marker | Plasma, serum | Based on stability of HDL in plasma, approx. 1–4 weeks at −80 °C, with cryo-preservants possibly longer [394] | Oxidation of LDL standard and protection by HDL fraction from individuals, dichloro-fluorescein fluorescence measurement | Higher HII associated with sepsis and shock in individuals with organ failure [395], poor outcome in subjects with hemodialysis [396] and diabetes [397]. | Analytically challenging |
| Dietary inflammatory index (DII) | Dietary marker | dietary intake | n.a. | FFQ | Higher DII related in meta-analyses to mortality of cancer, CVD, and total mortality [398], obesity [399] and cancer [400] | Only including dietary aspects, not further host-factors |
|
Publisher’s Note: MDPI stays neutral with regard to jurisdictional claims in published maps and institutional affiliations.
|
© 2021 by the authors. Licensee MDPI, Basel, Switzerland. This article is an open access article distributed under the terms and conditions of the Creative Commons Attribution (CC BY) license (http://creativecommons.org/licenses/by/4.0/).
Share and Cite
Menzel, A.; Samouda, H.; Dohet, F.; Loap, S.; Ellulu, M.S.; Bohn, T. Common and Novel Markers for Measuring Inflammation and Oxidative Stress Ex Vivo in Research and Clinical Practice—Which to Use Regarding Disease Outcomes? Antioxidants 2021, 10, 414. https://doi.org/10.3390/antiox10030414
Menzel A, Samouda H, Dohet F, Loap S, Ellulu MS, Bohn T. Common and Novel Markers for Measuring Inflammation and Oxidative Stress Ex Vivo in Research and Clinical Practice—Which to Use Regarding Disease Outcomes? Antioxidants. 2021; 10(3):414. https://doi.org/10.3390/antiox10030414
Chicago/Turabian StyleMenzel, Alain, Hanen Samouda, Francois Dohet, Suva Loap, Mohammed S. Ellulu, and Torsten Bohn. 2021. "Common and Novel Markers for Measuring Inflammation and Oxidative Stress Ex Vivo in Research and Clinical Practice—Which to Use Regarding Disease Outcomes?" Antioxidants 10, no. 3: 414. https://doi.org/10.3390/antiox10030414