Day Return
YTD Return
1-Year Return
3-Year Return
5-Year Return
Note: Sector performance is calculated based on the previous closing price of all sector constituents
Industries in This Sector
Select an Industry for a Visual Breakdown
| Industry | Market Weight | Day Return | YTD Return |
|---|---|---|---|
| All Industries | 100% | 2.24% | 2.28% |
| Internet Retail | 33.38% | 3.03% | 20.41% |
| Auto Manufacturers | 13.52% | 1.16% | -21.22% |
| Restaurants | 8.87% | 0.33% | -1.82% |
| Home Improvement Retail | 7.57% | 0.88% | -2.01% |
| Travel Services | 5.16% | 1.34% | 4.34% |
| Specialty Retail | 4.79% | 8.13% | 4.82% |
| Apparel Retail | 3.93% | 0.97% | -8.79% |
| Footwear & Accessories | 3.21% | 1.98% | -8.25% |
| Residential Construction | 3.19% | 1.30% | -0.89% |
| Auto Parts | 2.72% | 2.91% | -0.06% |
| Packaging & Containers | 2.45% | 1.61% | 5.28% |
| Lodging | 2.30% | 0.45% | 3.25% |
| Resorts & Casinos | 1.56% | 2.30% | -8.00% |
| Auto & Truck Dealerships | 1.54% | 9.98% | 16.96% |
| Gambling | 1.32% | 1.68% | 81.03% |
| Apparel Manufacturing | 0.92% | 1.84% | -0.94% |
| Leisure | 0.92% | 1.98% | 7.95% |
| Personal Services | 0.80% | 0.49% | -1.18% |
| Furnishings, Fixtures & Appliances | 0.72% | 1.51% | -2.28% |
| Recreational Vehicles | 0.50% | 0.71% | -13.32% |
| Luxury Goods | 0.30% | -0.30% | -9.12% |
| Department Stores | 0.29% | 5.43% | 0.19% |
| Textile Manufacturing | 0.04% | 2.09% | -14.95% |
Note: Percentage % data on heatmap indicates Day Return
All Industries
-
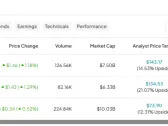
Largest Companies in This Sector
|
Name
|
Last Price
|
1Y Target Est.
|
Market Weight
|
Market Cap
|
Day Change %
|
YTD Return
|
Avg. Analyst Rating
|
|---|---|---|---|---|---|---|---|
| 184.73 | 215.50 | 32.07% |
|
|
|
Buy
|
|
| 181.25 | 178.29 | 9.65% |
|
|
|
Hold
|
|
| 334.80 | 386.23 | 5.54% |
|
|
|
Buy
|
|
| 273.52 | 318.23 | 3.29% |
|
|
|
Buy
|
|
| 92.34 | 109.98 | 2.33% |
|
|
|
Buy
|
|
| 228.84 | 253.06 | 2.18% |
|
|
|
Buy
|
|
| 3,461.18 | 3,973.44 | 1.96% |
|
|
|
Buy
|
|
| 94.55 | 112.00 | 1.79% |
|
|
|
Buy
|
|
| 157.99 | 152.82 | 1.67% |
|
|
|
Hold
|
|
| 3,145.83 | 3,214.94 | 1.44% |
|
|
|
Buy
|
Investing in the Consumer Cyclical Sector
Start Investing in the Consumer Cyclical Sector Through These ETFs and Mutual Funds
ETF Opportunities
|
Name
|
Last Price
|
Net Assets
|
Expense Ratio
|
YTD Return
|
|---|---|---|---|---|
| 176.75 | 20.065B | 0.09% |
|
|
| 304.09 | 6.291B | 0.10% |
|
|
| 105.52 | 3.337B | 0.40% |
|
|
| 59.22 | 1.606B | 0.61% |
|
|
| 78.91 | 1.456B | 0.08% |
|
Mutual Fund Opportunities
|
Name
|
Last Price
|
Net Assets
|
Expense Ratio
|
YTD Return
|
|---|---|---|---|---|
| 50.31 | 10.324B | 0.00% |
|
|
| 155.20 | 6.291B | 0.10% |
|
|
| 18.66 | 3.127B | 0.72% |
|
|
| 41.70 | 1.533B | 0.29% |
|
|
| 40.14 | 1.533B | 0.29% |
|
Consumer Cyclical Research
Discover the Latest Analyst and Technical Research for This Sector
-
Analyst Report: McDonald`s Corp
McDonald's is the world's largest restaurant chain, with more than 40,000 fast-food restaurants in over 100 countries. With a market capitalization of about $206 billion, MCD is a large-cap growth stock.
RatingPrice Target -
Analyst Report: D.R. Horton Inc.
D.R. Horton, based in Fort Worth, Texas is one of the largest homebuilders in the U.S., with homebuilding revenue of $31.7 billion on 82,918 closings for the fiscal year ended September 30, 2023. To be sure, DHI may be number one based on deliveries while Lennar, whose average selling price is about $60,000 higher than DHI's, may have higher revenue in some years. In the 4 quarters reported through May 1, 2024 DHI was a couple billion bigger. The company offers homes in 108 markets in 33 states. About 99% of revenue is from single-family detached homes. The average home price was down about 1% to $381,000 in FY23. The company's financial services segment also provides mortgage financing and title agency services. DHI's Rental division generated $2.6 billion in 2023. The company's fiscal year ends on September 30. The business is seasonal with the highest revenues and operating income generally delivered in the third (ending in June) and fourth (September) quarters than in the first (December) and second (March) quarters.
RatingPrice Target -
Analyst Report: Starbucks Corp.
Starbucks is a leading retailer of fresh-brewed coffee and branded merchandise. Its brands include Starbucks, Tazo Tea, and Frappuccino. With a market cap of $83.6 billion, SBUX shares are generally considered large-cap growth.
RatingPrice Target -
Market Digest: AMZN, DHI, DHR, ETN, HAL, MCD, SBUX, MA, PYPL, ELAN
Stock Market Looking to Get Past April's Stumble