Day Return
YTD Return
1-Year Return
3-Year Return
5-Year Return
Note: Sector performance is calculated based on the previous closing price of all sector constituents
Industries in This Sector
Select an Industry for a Visual Breakdown
| Industry | Market Weight | Day Return | YTD Return |
|---|---|---|---|
| All Industries | 100% | -2.60% | 9.53% |
| Oil & Gas Integrated | 36.77% | -1.89% | 12.08% |
| Oil & Gas E&P | 26.16% | -2.94% | 11.72% |
| Oil & Gas Midstream | 20.37% | -1.65% | 6.65% |
| Oil & Gas Refining & Marketing | 7.42% | -5.76% | 10.28% |
| Oil & Gas Equipment & Services | 7.03% | -3.30% | 0.52% |
| Uranium | 1.04% | -6.88% | 6.47% |
| Oil & Gas Drilling | 0.89% | -4.99% | -3.83% |
| Thermal Coal | 0.32% | -3.29% | -9.60% |
Note: Percentage % data on heatmap indicates Day Return
All Industries
-
Largest Companies in This Sector
|
Name
|
Last Price
|
1Y Target Est.
|
Market Weight
|
Market Cap
|
Day Change %
|
YTD Return
|
Avg. Analyst Rating
|
|---|---|---|---|---|---|---|---|
| 118.27 | 131.84 | 19.27% |
|
|
|
Buy
|
|
| 161.27 | 182.11 | 12.28% |
|
|
|
Buy
|
|
| 125.62 | 143.08 | 6.08% |
|
|
|
Buy
|
|
| 132.13 | 145.93 | 3.14% |
|
|
|
Buy
|
|
| 47.48 | 67.46 | 2.80% |
|
|
|
Buy
|
|
| 181.72 | 218.50 | 2.71% |
|
|
|
Buy
|
|
| 269.32 | 274.81 | 2.60% |
|
|
|
Hold
|
|
| 28.08 | 32.94 | 2.52% |
|
|
|
Buy
|
|
| 143.21 | 168.34 | 2.51% |
|
|
|
Buy
|
|
| 66.14 | 72.29 | 2.42% |
|
|
|
Hold
|
Investing in the Energy Sector
Start Investing in the Energy Sector Through These ETFs and Mutual Funds
ETF Opportunities
|
Name
|
Last Price
|
Net Assets
|
Expense Ratio
|
YTD Return
|
|---|---|---|---|---|
| 93.52 | 39.708B | 0.09% |
|
|
| 130.36 | 10.625B | 0.10% |
|
|
| 46.89 | 8.423B | 0.85% |
|
|
| 151.43 | 4.218B | 0.35% |
|
|
| 43.13 | 3.36B | 0.44% |
|
Mutual Fund Opportunities
|
Name
|
Last Price
|
Net Assets
|
Expense Ratio
|
YTD Return
|
|---|---|---|---|---|
| 65.12 | 10.625B | 0.10% |
|
|
| 90.81 | 5.738B | 0.38% |
|
|
| 48.40 | 5.738B | 0.38% |
|
|
| 6.04 | 3.701B | 6.24% |
|
|
| 5.51 | 3.701B | 6.24% |
|
Energy Research
Discover the Latest Analyst and Technical Research for This Sector
-
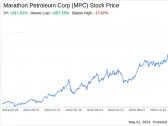
Analyst Report: Marathon Oil Corporation
Marathon is an independent exploration and production company primarily focusing on unconventional resources in the United States. At the end of 2022, the company reported net proved reserves of 1.3 billion barrels of oil equivalent. Net production averaged 343 thousand barrels of oil equivalent per day in 2022 at a ratio of 70% oil and NGLs and 30% natural gas.
RatingPrice Target -
Analyst Report: ONEOK, Inc.
Oneok provides natural gas gathering, processing, storage, and transportation as well as natural gas liquids transportation and fractionation. It owns extensive assets in the midcontinent, Permian, and Rocky Mountain regions.
RatingPrice Target -
Analyst Report: Enterprise Products Partners L.P.
Enterprise Products Partners is a master limited partnership that transports and processes natural gas, natural gas liquids, crude oil, refined products, and petrochemicals. It is one of the largest midstream companies, with operations servicing most producing regions in the Lower 48 states. Enterprise is particularly dominant in the NGL market and is one of the few MLPs that provide midstream services across the full hydrocarbon value chain.
RatingPrice Target -
Analyst Report: Schlumberger Ltd.
Schlumberger Ltd. is the world's leading oilfield services company, supplying technology, information solutions and integrated project management services that optimize reservoir performance. It employs approximately 82,000 people in 85 countries. SLB supplies a wide range of products and services, including seismic testing; formation evaluation; well testing and directional drilling; well cementing and stimulation; artificial lift and well completions; and consulting, software, and information management. It operates in nearly all major oilfield services markets, and typically generates higher returns on investment than peers. In 2023, the company generated 21% of its revenue from the U.S. and 79% from international markets.
RatingPrice Target