

1 The rise of passive index funds
Since the outbreak of the global financial crisis, private as well as institutional investors have massively shifted capital from expensive, actively managed mutual funds to cheap, index mutual funds and exchange traded funds (ETFs), which we subsume under the term passive index funds. ETFs and index mutual funds are technically different, but they share the fundamental feature that both seek to replicate existing stock indices while minimizing expense ratios.Footnote 1 In contrast, active funds employ fund managers who strive to buy stocks that will outperform, which leads to higher expense ratios. Hence, we are dividing asset management into two categories—actively and passively managed funds.Footnote 2 Between 2008 and 2015 investors sold holdings of actively managed equity mutual funds worth roughly U.S. $800 billion, while at the same time buying passively managed funds to the tune of approximately U.S. $1 trillion—a historically unprecedented swing in investment behavior.Footnote 3 As of year-end 2015, passive index funds managed total assets invested in equities of more than U.S. $4 trillion. Crucially, this large and growing industry is dominated by just three asset management firms: BlackRock, Vanguard, and State Street. In recent years they acquired significant shareholdings in thousands of publicly listed corporations both in the United States and internationally. The rise of passive index funds is leading to a marked concentration of corporate ownership in the hands of the Big Three.
In 2008, Gerald Davis pointed at the historically unique situation in the United States that had emerged when a small number of active mutual funds, such as Fidelity, became large shareholders in a surprisingly high number of firms. This situation was reminiscent of the early twentieth-century system of finance capital when business was under the control of tycoons such as J.P. Morgan and J.D. Rockefeller. But contrary to this earlier phase in the development of capitalism, and despite their great potential power, the large, early twenty-first-century actively managed mutual funds eschewed active participation in corporate governance. The large active funds preferred to “exit” rather than to exert direct influence over corporate governance.Footnote 4 Davis coined this system of concentrated ownership without control the “new finance capitalism.”
The rise of the Big Three over the past decade marks a fundamental transformation of the new finance capitalism. Unlike active mutual funds, the majority of passive index funds replicate existing stock indices by buying shares of the member firms of the particular index—or a representative selection of stocks in the case of indices comprising small firms that have less liquid stocks—and then hold them “forever” (unless the composition of the index changes).Footnote 5 What the consequences are of the combination of concentrated ownership with passive investment strategies is becoming a central and contested issue. On the one hand, passive investors have little incentives to be concerned with firm-level governance performance, because they simply aim to replicate the performance of a group of firms. On the other hand, the concentration of corporate ownership may entail a re-concentration of corporate control, since passive asset managers have the ability to exercise the voting power of the shares owned by their funds. Indeed, there are indications that the Big Three are beginning to actively exert influence on the corporations in which they hold ownership stakes. In the words of William McNabb, Chairman and CEO of Vanguard: “In the past, some have mistakenly assumed that our predominantly passive management style suggests a passive attitude with respect to corporate governance. Nothing could be further from the truth.”Footnote 6 In a similar vein, Larry Fink, founder, CEO and Chairman of BlackRock writes in a letter to all S&P 500 CEOs that he requires them to engage with the long-term providers of capital, i.e., himself.Footnote 7
Our aim here is to shed new light on the rise of the Big Three passive asset managers and the potential consequences for corporate governance. We present novel empirical findings, but we also identify possible channels of influence that should be the focus of future research. In other words, the purpose of this paper is both to contribute new empirics on the Big Three as well as to shape the research agenda concerning the momentous rise of passive index funds. The paper continues as follows. The next section expands on theoretical discussions about ownership concentration in the United States and its impact on corporate control in the age of asset management. Furthermore, we discuss the pivotal shift from active to passive asset management and the sources of potential shareholder power for both types of investors. Subsequently, in section three we comprehensively map and visualize the ownership positions of the Big Three in American listed corporations. The analysis of the voting behavior of BlackRock, Vanguard, and State Street is conducted in section four, while section five is devoted to discussing the potential avenues of “structural” or “hidden power” by the Big Three. In section six, we highlight how passive index funds may contribute to the development of new financial risk. Finally, section seven concludes.
2 The age of asset management capitalism
2.1 New finance capitalism
In the early 1930s, Adolf Berle and Gardiner Means famously coined the phrase of the “separation of ownership and control,” meaning that there were not anymore blocks of ownership large enough to wield effective control over U.S. publicly listed corporations.Footnote 8 The dispersion of corporate ownership that Berle and Means observed empirically represented a markedly changed situation compared to the first decades of the twentieth century, when most large corporations had been owned and controlled by banks and bankers—what Rudolf Hilferding referred to as Finanzkapitalismus (finance capitalism).Footnote 9 Dispersed ownership however entailed that instead of the owners, it was the managers and directors who wielded control. This, in turn, led to the recognition of the principal-agent problem that underlies modern corporate governance theory: Given their collective action problem, how can the suppliers of capital (principals) ensure that the managers (agents) act in their best interests? In response to this question, corporate governance regulation has progressively shifted towards a more powerful position for shareholders. The extent to which the separation of ownership and control took shape has been a debate ever since. Nonetheless, there is an overwhelming consensus that since the second half of the twentieth century corporate ownership in the United States is by and large fragmented and dispersed.Footnote 10
Early signs of a fundamental change in the organization of corporate ownership emerged in the late twentieth century. Useem signaled the growing importance of mutual funds in the early 1990s and argued that we have moved from shareholder towards investor capitalism.Footnote 11 After the turn of the century and more than seven decades after Berle and Means, Davis went a step further and argued that the rapid rise of assets invested by actively managed mutual funds in equity markets and the ensuing re-concentration of corporate ownership led to a “new finance capitalism.”Footnote 12 Davis found that by 2005 active mutual funds had accumulated 5 percent blockholdings in hundreds of publicly listed U.S. companies. Being the single largest shareholder thus gave the biggest mutual funds—such as his running example Fidelity—potential power over the corporate governance of these listed companies by means of dominating corporate elections.
However, despite this great potential power, actively managed mutual funds at that time did not seek to influence corporate decision-making. Davis mentions three reasons for this. First, he points out that owners holding more than 10 percent of voting rights are considered as “insiders,” which significantly restricts their trading possibilities. Second, actively managed mutual funds are faced with potential conflicts of interest because the firms they are invested in are often also their clients. Particularly eminent is this where mutual funds are large providers of pension fund management for corporations. This curbs the willingness of funds to pursue shareholder activism.Footnote 13 Third, and more general, shareholder activism is always costly—and the costs are borne only by the activist, while the benefits are enjoyed by all shareholders. Hence, Davis concluded that “networks of concentrated yet liquid ownership without control seem to be the distinctive feature of the new finance capitalism.”Footnote 14 Davis pointed out that this observed new finance capitalism is historically unique, but also cautiously concluded that its durability remains to be seen. One decade later, we can safely conclude that the re-concentration of corporate ownership was not a temporary market anomaly, but a fundamental reorganization of the system of corporate governance. However, the period 2005–15 is also one of significant transformation of the new finance capitalism.
2.2 From active to passive asset management and the rise of the Big Three
Passive index funds have enjoyed rapid growth during the last ten years, at the expense of actively managed funds. Passive funds have increased their market share from 4 percent of total equity mutual fund assets in 1995 to 16 percent in 2005. From 2005 to 2015, index funds have doubled their market share to 34 percent.Footnote 15 The main reason of this rise is the lower cost for investors compared to actively managed funds.Footnote 16 In the boom times before the global financial crisis, most investors tolerated high fees, hoping that mutual fund and hedge fund managers would deliver superior returns because of their active trading strategy. However, it is has been becoming increasingly clear in recent years that the majority of both actively managed mutual funds as well as hedge funds are not able to consistently generate higher returns than established benchmark indices, such as the S&P 500.Footnote 17 In fact, only 16 percent of large-capitalization mutual funds are forecasted to beat their particular indices in 2016—the worst performance on record.Footnote 18
Figure 1 shows the rapid growth of passive index funds that invest in equities. Note that we have excluded assets invested in bonds or commodities because they do not influence corporate governance. Index mutual funds remained the larger category until 2007 when ETFs took the lead. Since 2008, both categories have grown with a roughly similar pace, doubling their assets under management in just three years from 2011 to 2014. In total, passive index funds (equity) had at least U.S. $4 trillion in assets under management at end-2015, thus surpassing the assets under management of the entire hedge fund industry.Footnote 19
Figure 1: Assets under management by equity passive index funds 2000–2015, bn U.S.$.
A remarkable feature of the passive index fund industry is its high level of concentration. In the ETF segment, the market shares in December 2016 have been 37 percent for BlackRock, 18.5 percent for Vanguard, and 15.5 percent for State Street, respectively.Footnote 20 Hence, together these three firms stand for a stunning 71 percent of the entire ETF market; all other ETF providers have market shares below 3.3 percent. Data about market shares in index mutual funds are not publicly available, but it seems clear that Vanguard dominates this segment with probably at least 75 percent market share.Footnote 21
Existing rankings of asset managers typically include both assets in equites and in bonds, which are not of principal concern in regards to corporate control. Table 1 gives a novel presentation of the top U.S. asset managers in equities and illustrates that BlackRock, Vanguard, and State Street dominate the passive index fund industry. Together they manage over 90 percent of all Assets under Management (AuM) in passive equity funds. The share of AuM in passive funds is well over 80 percent for BlackRock, Vanguard, and State Street, thus making them the only three decidedly passive asset managers in the market. Therefore, we can fittingly refer to them as the Big Three passive asset managers.Footnote 22
Table 1: The Top 15 U.S. Asset Managers (Equity), June 2016

Source: In order to compile this table we have collected data on assets under management (AuM) from the websites of the largest asset managers (mostly quarterly reports), while Vanguard has supplied us with the information via email. Some firms, such as Fidelity, have not replied and therefore we have also used the Morningstar fund database to compute the approximate AuM invested in passive index funds.
Note: Ranked according to AuM in passive index funds; multi-asset funds have been assumed to invest 60% in equites and 40% in bonds.
Although the Big Three have in common that they are passive asset managers, they are quite different in their own corporate governance structures. BlackRock is the largest of the Big Three—and represents the biggest asset manager in the world. At mid-2016, BlackRock had U.S. $4.5 trillion in assets under management.Footnote 23 BlackRock is a publicly listed corporation and thus finds itself under pressure to maximize profits for its shareholders. Vanguard—with U.S. $3.6 trillion in assets under management in mid-2016—is currently the fastest growing asset manager of the Big Three. In 2015, the group had inflows of U.S. $236 billion, the largest annual flow of money to an asset managing company of all-time.Footnote 24 The main reason for the high growth of Vanguard is that it has the lowest fee-structure in the entire asset management industry. Vanguard is mutually owned by its individual funds and thus ultimately by the investors in these funds. Consequently, the group does not strive to maximize profits for external shareholders but instead operates “at-cost,” which allows Vanguard to offer the lowest fees in the industry. Vanguard pioneered passive investing by creating the “First Index Investment Trust” in 1975, however this investment approach was attacked as “un-American” at the time.Footnote 25 State Street is slightly smaller than BlackRock and Vanguard, but still one of the largest global asset managers. In mid-2016, it had U.S. $2.3 trillion in assets under management.
Most observers predict that passively managed funds will continue to grow (and at the expense of actively managed funds, inevitably). As global economic growth rates are not picking up—a situation which has been characterized as “secular stagnation” or the “new mediocre”—average returns for most international equity and debt markets are expected to be comparatively low in the near to medium future.Footnote 26 McKinsey Global Institute has even forecasted that over the next twenty years average returns for U.S. and European equities could be as low as 4 percent per year, while U.S. and European government bonds could even have return rates of zero.Footnote 27 This further bolsters the competitive advantage of low-cost passive investors vis-à-vis actively managed funds. Ernst & Young has forecasted annual growth rates for the ETF industry of between 15 and 30 percent in the next few years.Footnote 28 According to PwC, assets invested in ETFs are predicted to double until 2020.Footnote 29 These forecasts make it imperative that we study the different sources of potential shareholder power of these large and growing passive asset management corporations, and the Big Three in particular.
2.3 The power of passive asset managers
When we talk about the power of large asset managers, we are concerned with their influence over corporate control and as such their capacity to influence the outcomes of corporate decision-making.Footnote 30 Shareholders can exert power through three mechanisms. First, they can participate directly in the decision making process through the (proxy) votes attached to their investments. In a situation of dispersed and fragmented ownership, the voting power of each individual shareholder is rather limited. But blockholders with at least five percent of the shares are generally considered highly influential, and shareholders that hold more than 10 percent are already considered “insiders” to the firm under U.S. law. The growing equity positions that passive asset managers hold thus increase this potential power.
However, this potential to influence corporate decision-making does not imply that shareholders will actually exercise their power. According to Davis, the large active asset managers in the early twenty-first century, such as Fidelity, preferred to sell their shares when they were dissatisfied with the performance of a particular firm, because the “Wall Street Walk” is easier than activism.Footnote 31 This exit option is a second, indirect way of exerting shareholder power. If a considerable amount of shares are sold this negatively impacts the share price and puts pressure on the management team. In order to contain competition in the market for corporate control, management teams thus have an incentive to make sure their decisions are appreciated by their shareholders.
Third, shareholders can influence corporate decisions by direct engagements and “voice” their concerns directly to management.Footnote 32 A recent survey found that 63 percent of very large institutional investors have engaged in direct discussions with management over the past five years, and 45 percent had had private discussions with a company's board outside of management presence.Footnote 33 The dominant view in the literature is that the mechanisms of exit and voice are complementary devices, with intervention typically occurring prior to a potential exit.Footnote 34 The threat of exit is the base that allows the exercise of power through voice. Passive asset managers however do not “exit.”Footnote 35 This may have important implications for the power of passive investors because they cannot credibly claim to exit a firm based on performance assessments.
More fundamentally, a passive investment strategy leads to the question of why passive investors would be interested at all to concern themselves with corporate governance at the level of individual firms. If a fund holds—for instance—500 stocks the risk of any individual stock will be irrelevant. Indeed the incentive structure of passive index fund managers is such that they are rewarded more for keeping the costs low than for improving firm governance.Footnote 36 Since passive managers are willing to take whatever return-risk relationship the market offers, why vote at all?
In addition, the decentralized attribution of ownership in separate funds and ETFs may hamper a centralized voting strategy in at least two ways. BlackRock for instance has more than 200 mutual funds and equity ETFs as well as several closed end equity funds and hedge funds—all of which could have positions in a particular firm. These portfolios may have different interests when it comes to shareholder vote. Even more differences occur because BlackRock holds some shares in short positions. Any vote that helps the long positions in BlackRock will hurt the short positions. So which way will BlackRock vote? These decentralized ownership structures may also hamper the ability to systematically use the voting power at all as it demands a serious coordination effort on behalf of the asset managers. Still in 2015, BlackRock faced a record U.S. $3.25 million fine by the German financial watchdog BaFin for misrepresenting their stakes in German firms. BlackRock admitted that they had to reorganize their internal procedures in order to be able to report on their aggregated ownership. If BlackRock already struggles with reporting on their ownership stakes, it may be even more difficult for them to consistently use their proxy votes, even if they wanted to do so.
Passive investors, active owners?
At the same time, the Big Three explicitly state that they want to be active shareholders. State Street for instance highlights that they follow “a centralized governance and stewardship process covering all discretionary holdings across our global investment centers. This allows us to ensure we speak and act with a single voice and maximize our influence with companies by leveraging the weight of our assets.”Footnote 37 BlackRock established a central team to report on and direct its proxy voting and corporate governance recommendations in 2009 and states that it “will cast votes on behalf of each of the funds on specific proxy issues.”Footnote 38 In 2016, BlackRock, Vanguard, and State Street significantly expanded their corporate governance teams. What, then, are the opportunities and the incentives the Big Three have for an active corporate governance strategy?
Arguably, the reasons Davis used to explain the inactivity of active investors in terms of corporate governance may not apply to passive investors—or are at least diminished significantly. First, unlike active funds, passive funds rarely hold ownership stakes in listed corporations larger than 10 percent, which would make them “insiders” under U.S. law.Footnote 39 This means that they are less restrained to use their shareholder power. Second, Davis argued that actively managed funds may revert from voting on their shares because the firms they are invested in are often also their clients, particularly in pension fund management. While pension business still amounts to hundreds of billions for the Big Three, the proportion of this line of business seems to be smaller than for Fidelity. And third, now that the Big Three have reached such a large scale, shareholder activism has become much “cheaper” for them in relative terms. This all increases the opportunities for the Big Three to use their shareholder power. And while it is true that they cannot credibly threaten management with permanent exit (only with temporary exit via share lending to short-sellers), they can threaten to vote against management at the annual general meeting (AGM). This is generally considered as a clear signal of discontent towards management, which gives management teams an incentive to keep large shareholders from voting against their proposals. Management teams may also want to keep a good relationship with their passive blockholders because their votes are particularly important during key moments such as proxy fights or takeover bids. Because they are blockholders, the voting power attached to their equity investments therefore serves as leverage for private engagements as well.
This leaves the question of what incentives passive investors have to pursue centralized corporate governance strategies. After all, as pointed out above, the risks of individual stocks are largely irrelevant to their business model. There are, however, at least two types of incentives to pursue an active corporate governance strategy. The first relates to their role and responsibility as a shareholder. Whereas in previous times the concentration of corporate control and the concomitant influence of large blockholders was seen as problematic, today the opposite is true: Large blockholders are expected to vote because otherwise managers would be too powerful. Legally, the fiduciary responsibility of institutional investors towards their clients includes that they are expected to fulfill their role as a shareholder, including voting at the AGM. Different funds within the same group may seek to minimize the costs associated with monitoring a company and centralize this monitoring role internally. This leads at least to a form of reticent behavior: “a generally reactive, low cost activism.”Footnote 40
Second, while active investors can and will sell shares when they observe or anticipate diminishing (future) returns, passive investors are generally “stuck.” This means that their main interest is not short or medium term value creation, as is the case for most investors. Instead, their main interest is in long-term value creation. As Vanguard explains: “Because the funds’ holdings tend to be long term in nature (in the case of index funds, we're essentially permanent shareholders), it's crucial that we demand the highest standards of stewardship from the companies in which our funds invest.”Footnote 41 Although the Big Three are not fully similar, they have shared incentives as passive long-term investors. And together, they are a force to be reckoned with. For example, in 2015 activist investor Nelson Peltz rallied against DuPont's CEO Ellen Kullman over whose slate of directors should be elected to DuPont's board. The outcome of this high profile proxy contest was determined when the Big Three disclosed that they were voting all their shares in favor of Kullman. The Big Three did not follow Institutional Shareholder Services (ISS) recommendations and as such voted against most of the regular short and medium term oriented shareholders. This illustrates that the Big Three at times may have a conflict of interest with short-term oriented investors. For this reason, they have an incentive to influence management to act in their interests. Indeed, McCahery et al find that large institutional investors with a longer time horizon and less concern about stock liquidity intervene more intensively with management teams through private engagements.Footnote 42
2.4 Research approach and data
In order to shed light on the opposing views on the power position of the Big Three, the first step must be to develop a better understanding of their ownership positions in contemporary equity markets. Information on the ownership profiles of the Big Three is anecdotal, incomplete, or difficult to compare. We therefore engage in a comprehensive mapping of the ownership positions of the Big Three. In addition, we examine how concentrated corporate ownership is when we combine the positions of the Big Three. The second step is to investigate the extent to which the Big Three are able and willing to use their proxy votes and follow a centralized proxy voting strategy. If the Big Three follow a strategy where they pursue influence through their proxy votes, we expect a high level of similarity of the voting behavior of their funds. Therefore, we investigate the voting records of the separate funds of U.S. asset managers at AGMs. This allows us to compare the voting behavior of the Big Three to other asset managers. Third, once we have established the level of internal consistency of proxy voting, we conduct an explorative analysis of the type of proposals where the Big Three oppose management. We use this analysis to see how active the Big Three actually are and if they indeed can be seen as reticent investors.
In order to analyze the voting behavior of asset managers, we used data from the ISS website. ISS is a major proxy voting advisory firm that records the voting behavior of investors. Proxy votes are collated by ISS for their clients and are publicly available. We collected a set of 8.6 million votes on 2.7 million unique proposals at AGMs worldwide. These votes are cast through 3,545 funds that are part of a set of 131 Asset Managers. From this we created a cleaned set of 117 asset managers and 1.45 million proposals voted on by their funds at AGMs. These disclosures are legally mandated in the United States, which means the data on the voting of U.S. asset managers voting in U.S. companies is of very high quality.Footnote 43
For the analysis of ownership concentration, we use data from the Orbis database by Bureau van Dijk. Orbis provides information on over 200 million firms worldwide, with over 59 million in the Americas, giving expansive coverage of the ownership holdings of all major asset managers. Over 140 providers collect data from commercial registers, Annual Reports and SEC Filings to create the database, enabling unprecedented insight into the scale and scope of asset managers. Compared to Thomson One, another database often used for studies on corporate governance, Orbis is as accurate but more complete (Orbis also reports on families as owners which is crucial in determining where the Big Three are the largest owner). For the analysis of the United States we downloaded all 3,882 publicly listed companies, corresponding to the exchanges: “NYSE MKT,” “NYSE ARCA,” “NASDAQ/NMS,” “NASDAQ National Market,” and “New York Stock Exchange (NYSE).” We excluded the following two company categories: “Mutual and pension fund/Nominee/Trust/Trustee” (932 companies) and “Private equity firm” (thirty-eight companies), because we focus on the ownership of U.S. publicly listed corporations and entities belonging to these two categories are not owned and controlled by public shareholders. We excluded among shareholders “State Street Bank and Trust Co.” because this subsidiary of State Street acts as a custodian, holding the shares for the respective ultimate owners. Public ownership (many small ownership stakes combined) was also excluded.
3 The power position of the Big Three in the network of corporate ownership
3.1 Breadth and depth of the Big Three's blockholdings
In this section, we conduct a comprehensive analysis of the significant ownership positions of the Big Three. We focus on two central dimensions of ownership by institutional investors—breadth and depth. An investor has broad ownership when being invested in a large number of corporations. In addition to this “breadth” dimension, it is also important to take into account the “depth” scale of ownership—the size of the individual holdings. Thus, breadth and depth together provide a comprehensive picture of the ownership profile of an investor. Table 2 presents the fifteen largest global holders of 3 percent blocks in publicly listed corporations—the higher the number of holdings the broader the ownership profile of the asset manager. Furthermore, we show three different levels of ownership depth: >3 percent, >5 percent, and >10 percent blockholdings.
Table 2: The Top 15 Global Blockholders of Corporate Ownership, March 2016
Source: Authors, based on Orbis.
Note: Ranked according to 3% blockholdings; Big Three in italics. The >10%holdings are also included in the >5% and so on.
BlackRock and Vanguard are by far the broadest global blockholders in listed corporations according to both the 3 percent and 5 percent thresholds. These blockholdings are located in a number of countries around the world; the majority, however, is in the United States. BlackRock has about two thousand 5 percent holdings in the United States; a non-negligible number when taking into account that in total there are only about 3,900 publicly listed U.S. corporations. In other words, BlackRock holds 5 percent blocks in more than one-half of all listed companies in the United States. That is significantly more than five years ago; According to Davis, in 2011 BlackRock had owned roughly 1,800 five percent blockholdings in the United States, while Fidelity owned 680.Footnote 44
Vanguard's ownership positions also concentrate in the United States. Of the 1,855 five percent blockholdings, about 1,750 are in U.S. listed companies. As Table 2 shows, both BlackRock and Vanguard hold relatively few 10 percent blocks; the former owns about 300 of these positions in U.S. listed companies and the latter only 160 – note that this refers to the asset manager as a whole, the US 10 percent “insider” law only pertains to individual funds, however. State Street is much smaller in the large blockholdings, as its ownership profile is both narrower and shallower. With about 1,000 three percent holdings in U.S. companies, State Street is the fifth largest asset manager in the segment of these small blockholdings. Above the 5 percent threshold, however, State Street only has 260 blocks in U.S. listed corporations—and twelve above the 10 percent level. Two other asset managers shown in Table 2 are also noteworthy: Fidelity and Dimensional Fund Advisors (DFA). Fidelity is by far the largest actively managed mutual fund group (see also Table 1). In contrast to the Big Three, Fidelity has a much narrower and deeper ownership profile; it holds roughly 700 five percent blockholdings in U.S. corporations (the other 600 are international), and of this about 300 are 10 percent blocks. DFA has a very broad and shallow ownership profile that resembles that of a passive index fund; it holds approximately 1,100 three percent holdings and 540 five percent blocks in U.S. publicly listed companies, but virtually no 10 percent ones. Arguably, the reason is that DFA builds its own in-house quantitative models, using different company parameters, which focus primarily on small and undervalued companies.Footnote 45 The Big Three, on the other hand, replicate large and established stock indices, such as the S&P 500, which are publicly available. This necessarily leads to the situation that BlackRock, Vanguard, and State Street hold parallel ownership positions in an increasing number of publicly listed companies.
3.2 Combined ownership of the Big Three in the United States
As a consequence of their dominance in the asset management industry, a large and growing number of publicly listed companies in the United States face the Big Three—seen together—as their the largest shareholder. In 2015, this has been the case in 1,662 listed U.S. corporations, with mean ownership of the Big Three of over 17.6 percent (Figure 2). The total number of publicly listed firms in the United States amounts to approximately 3,900. Thus, when combined, BlackRock, Vanguard, and State Street constitute the single largest shareholder in at least 40 percent of all listed companies in the United States. Together, these 1,662 American publicly listed corporations have operating revenues of about U.S. $9.1 trillion, a current market capitalization of more than U.S. $17 trillion, possess assets worth almost U.S. $23.8 trillion, and employ more than 23.5 million people.
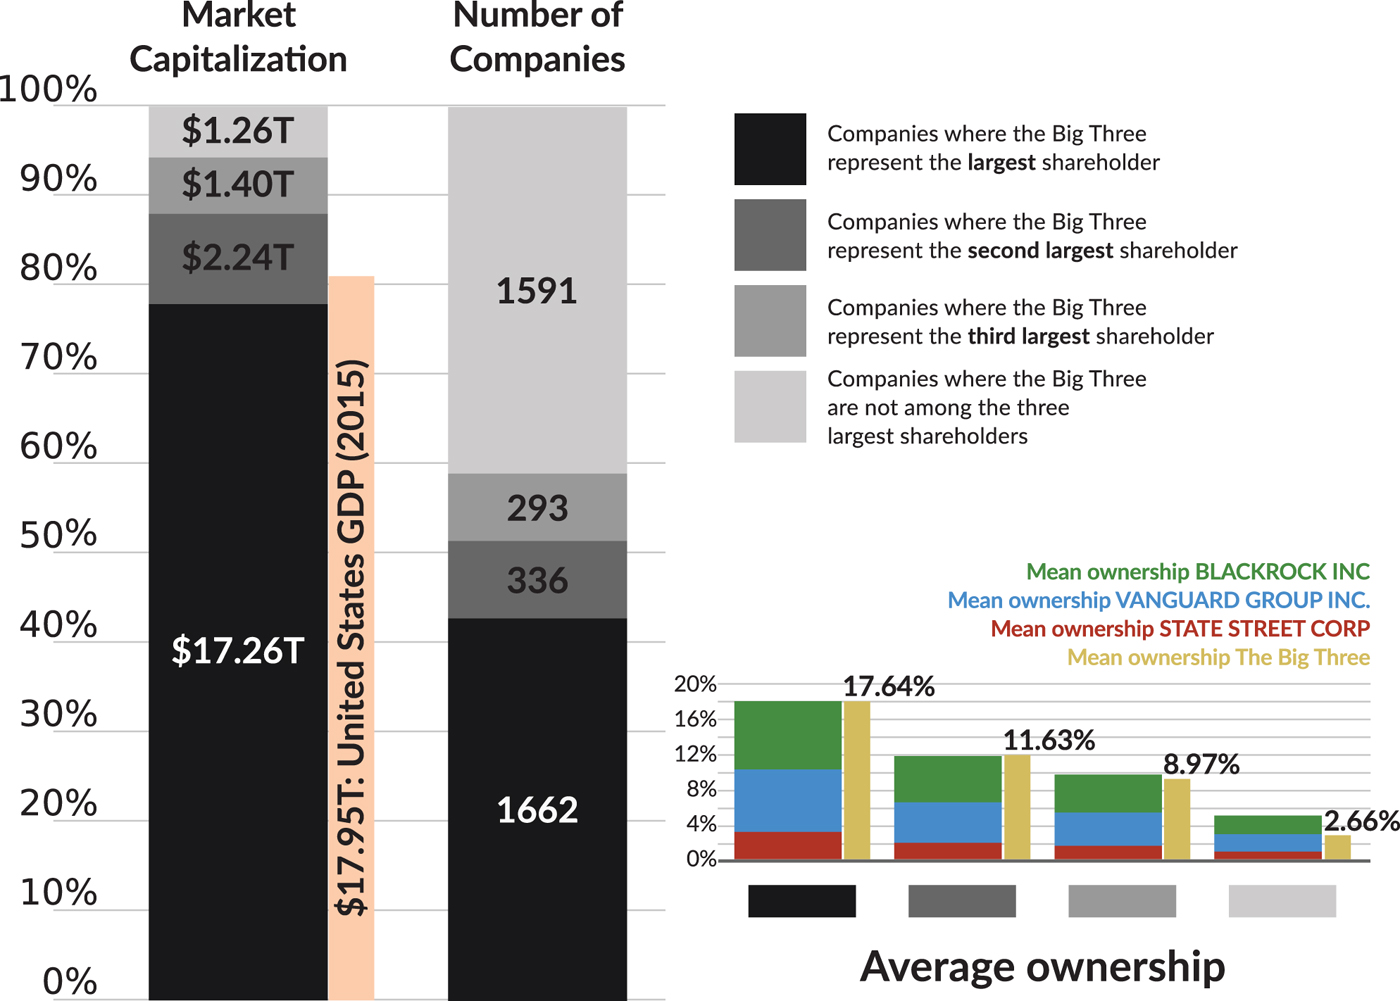
Figure 2: Statistics about the ownership of the Big Three in listed U.S. companies.
When restricted to the pivotal S&P 500 stock index, the Big Three combined constitute the largest owner in 438 of the 500 most important American corporations, or roughly in 88 percent of all member firms. These 438 co-owned corporations account for about 82 percent of S&P 500 market capitalization. Large companies where the Big Three are not the main shareholders are typically dominated by private individuals: Alphabet (Sergey Brin and Larry Page), Berkshire Hathaway (Warren Buffett), Amazon.com (Jeff Bezos), Facebook (Mark Zuckerberg), Walmart (Walton family), Oracle (Larry Ellison), Comcast (Roberts family) and Kraft-Heinz (Berkshire Hathaway and 3G Capital). In the vast majority of the member firms of the S&P 500, however, the Big Three combined represent the single largest owner.
In Figure 3 we visualize the network of owners of publicly listed corporations in United States, focusing on ownership ties larger than 3 percent. The size of each node shown reflects the sum of its ownership positions in U.S. listed companies (in percent, only counting positions above the three percent threshold). The 1,662 firms in which the Big Three (themselves in magenta) together are the largest shareholder are shown in green; firms in which they constitute the second largest shareholder are orange, and blue denotes cases where they represent the third largest owner. Finally, cyan nodes are companies in which the Big Three are not among the three largest shareholders. Grey nodes correspond to shareholders of publicly listed companies that are not themselves listed—e.g., Fidelity, DFA, and Capital Group. This visualization underscores the central position of BlackRock and Vanguard in the network of corporate ownership. Both are significantly larger than all other owners of listed U.S. corporations. Fidelity has the third biggest size, followed by State Street and Dimensional Fund Advisors. All three, however, are considerably smaller than Vanguard and BlackRock.

Figure 3: Network of ownership and control by the Big Three in listed U.S. firms.
The size of a node in the visualization can be interpreted as the potential shareholder power of the particular owner within the network of control over listed companies in the United States. Thus, when seen together, the Big Three occupy a position of unrivaled potential power over corporate America. The graph gives a good impression of the fact that we witness a concentration of corporate ownership, not seen since the days of J.P. Morgan and J.D. Rockefeller. However, these finance capitalists of the gilded age exerted their power over corporations directly and overtly, through board memberships and interlocking directorates. This is not the case with the Big Three. Hence, we now examine the more hidden forms of corporate governance behavior of the Big Three.
4 Do the Big Three follow a centralized voting strategy?
The next question is to what extent the Big Three use their potential shareholder power through an active centralized corporate governance strategy. We therefore measure how coordinated voting behavior of asset managers is in corporate elections across their funds, as well as how often they vote with management. The voting data records the management recommendation and the shareholders vote. Shareholder votes were recorded as either, “For,” “Against,” “Abstain,” or “Withhold.” We grouped the shareholder votes into two categories: votes agreeing with the management recommendation are voting with management; all others are voting not with management.
Figure 4 shows the result of the analysis and includes the voting behavior of 117 distinct asset managers in our database, all with at least two funds voting in the same AGM at the same time. Internal disagreement measures the percentage of proposals where funds within an asset manager voted in different directions. External disagreement measures the percentage of cases where an asset manager voted against the management recommendation. Take for instance Calvert Investment, an activist investor. Figure 4 shows that over 40 percent of Calvert votes are against the management recommendation. Their management-unfriendly strategy goes together with a high level of internal agreement: in 99.985 percent of the proposals, all their funds voted in the same direction.
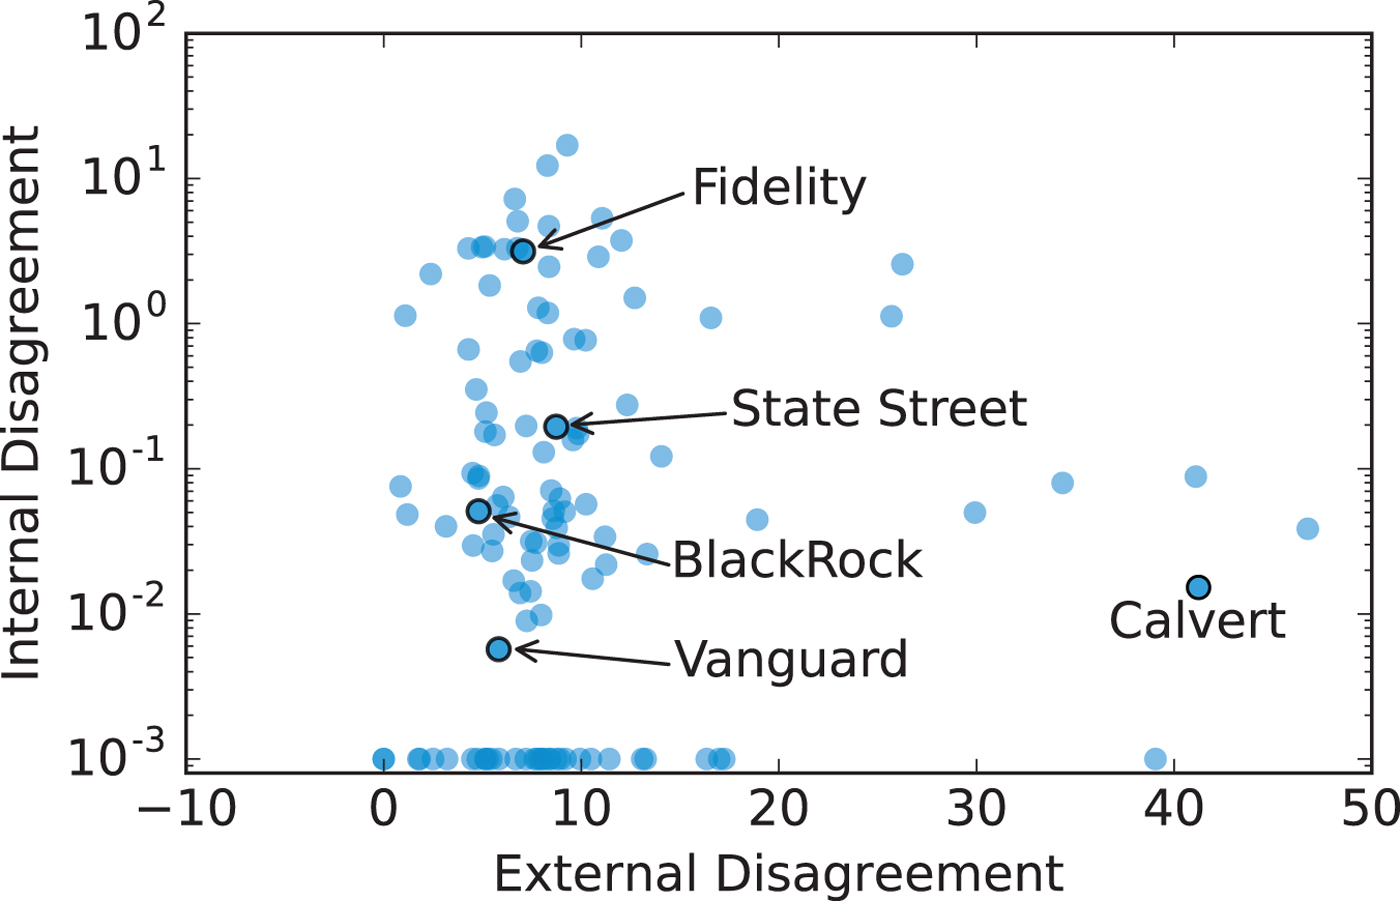
Figure 4: Coordination and pro-management inclination of voting behavior.
If we now turn to the voting behavior of the Big Three, a number of observations can be made. Overall, the internal agreement in proxy voting among the Big Three's funds is remarkably high. In fact, BlackRock and Vanguard are on the forefront of asset managers with internally consistent proxy voting behavior. At BlackRock, in 18 per 100,000 of the proposals one of their funds did not vote along with the other funds, and for Vanguard this is even more consistent with only 6 per 100,000 of the proposals receiving mixed votes. State Street also shows a low level of internal disagreement, 195 per 100,000, though somewhat higher than BlackRock and Vanguard. This clearly evidences that the Big Three are able and do indeed apply centralized voting strategies. The very high level of consistency also implies that there is no difference between the passive and the active funds under their management, disregarding the funds’ arguably different interests as discussed in section 2. In fact, at least one prominent case has been reported where the active side of BlackRock convinced the central corporate governance team to adopt its stance.Footnote 46 Active asset managers show higher levels of disagreement, reflecting the freedom of its fund managers to cast the proxy votes. Fidelity, for instance, displays significantly higher levels of disagreement in its proxy voting, with internal disagreement in 3,144 per 100,000 votes.
Friends or foes of management?
The external agreement on the horizontal axis indicates the share of proposals where the fund votes against management. Figure 4 shows that by and large, management can count on the support of asset managers. The voting behavior of BlackRock, Vanguard, and State Street is similar to that of most active mutual funds: They side with management in more than 90 percent of votes. This echoes increasing concerns of various stakeholders about the lacking response of investment funds on critical corporate governance issues such as executive pay. Understanding the topics on which the Big Three oppose management is therefore an important research issue. A thorough analysis requires coding and categorizing all the 8.6 million proposals in our database, a laborious undertaking that we leave for future research. We did, however, conduct an exploratory analysis of the cases where the Big Three do not vote with management.
Management can recommend to vote for or against a proposal, and the Big Three can choose to follow or oppose. A first telling observation is that only a small fraction of the opposition of the Big Three against management occurs in proposals where management recommends voting against (BlackRock 6 percent; Vanguard 2 percent; State Street 5 percent). Proposals that management recommends to oppose are typically issues put on the agenda by activist shareholders. This implies that the Big Three ally with management against such shareholder proposals—in fact, the ability to repel unwelcome activist investors may be an important part of the potential influence of the Big Three over management. Consistent with this finding is that a large majority of proposals where the Big Three vote against (against the proposal itself, not against the management recommendation) are related to Environmental, Social, and Governance (ESG), which are mainly proposed by activist shareholders. Based on additional data from ProxyInsight we know that 77 percent of BlackRock's “against” votes are in the domain of ESG, followed by 44 percent of Vanguard's and 43 percent of State Street's.Footnote 47
Perhaps most interesting are the proposals where the Big Three oppose a positive management recommendation. We found that about half of them concern the (re)election of the board of directors (BlackRock 50 percent; Vanguard 46 percent; State Street 45 percent). This suggests a proxy voting strategy where the Big Three typically support management, but will use their shareholder power to vote against management when they are dissatisfied. This leads to two conclusions. First, the voting behavior of the Big Three at AGMs is by and large management-friendly and does not reflect a highly engaged activist corporate governance policy. Second, the high propensity to vote against management (re)elections is consistent with the idea that the Big Three use their voting power to make sure they have the ear of management. Instead of open activism, the Big Three may prefer private influence. In the words of Larry Fink, CEO of BlackRock: “As an indexer, our only action is our voice and so we are taking a more active dialogue with our companies and are imposing more of what we think is correct.”Footnote 48 BlackRock reports in detail on how many times it informally engages with management, including statistics broken down by type of meeting and region going back to 2010. From mid-2014 to mid-2015, BlackRock has performed over 1,500 private “engagements” with companies held in their portfolio, 670 in the Americas and about 850 in the rest of the world—Vanguard had over 800 company engagements.Footnote 49 Hence, the Big Three may choose not to oppose management overtly but rely on private “engagements” with their invested companies. In fact, BlackRock reportedly believes that “meetings behind closed doors can go further than votes against management”—and that the asset manager typically gives opposing corporations one year before voting against them.Footnote 50 Each of the Big Three alone holds considerable ownership and thus potential to influence hundreds of U.S. corporations in such private encounters. In addition to the direct influence of the Big Three, they may also exert a form of indirect or structural power.
5 Structural power of passive investors?
The analysis of the voting behavior underscores that the Big Three may be passive investors, but they are certainly not passive owners. They evidently have developed the ability to pursue a centralized voting strategy—a fundamental prerequisite to using their shareholder power effectively. In addition to this direct exercise of shareholder power, the extent of the concentration of ownership in the hands of the Big Three may also lead to a position of structural power. Structural power emerges from a set of fundamental (asymmetrical) interdependencies between actors, such that one actor pro-actively takes into account the interests of a structurally powerful other.Footnote 51 Structural power arises from the occupation of core positions within interconnected structures, such as global financial markets.Footnote 52 In comparative political economy it typically refers to the structural power business holds over the state, because firms and capital holders control the investment decisions on which the economy depends for growth. A similar logic underpins the concept of systemically important financial institutions: They are important because the system is dependent on them to function well. The dominant position of the Big Three in the network of ownership as visualized by Figure 3 provides them with what Young calls “structural prominence” in corporate governance.Footnote 53 This position of prominence may potentially lead to a kind of “disciplinary power” over management as Roberts et al. have found for active funds: “the discipline is realised in anticipation within the self, or at least is rationalised in a defensive way that presents the self as already wanting what the investor wants.’”Footnote 54
The exact extent of the structural power exerted by passive index funds is a crucial question for future empirical research, as it may have far-reaching consequences. For instance, passive index funds have no reason to support aggressive price cuts or other measures that aim to take away revenue from competitors, because in many concentrated industries they own most of the competing firms. Elhauge calls the hundreds of parallel ownership positions by the Big Three “horizontal shareholding”—the constellation in which “a common set of investors own significant shares in corporations that are horizontal competitors in a product market.”Footnote 55 And when firms proactively internalize the objectives of the Big Three, their common ownership in competing firms could entail significant anticompetitive consequences. A small but growing body of empirical research suggests that this anticompetitive effect may indeed be significant. Recent work shows that for the U.S. airline industry common ownership has contributed to 3–11 percent increases in ticket prices.Footnote 56 Azar et al. analyzed within-route airline ticket price variation over time to identify a significant effect of common ownership. In addition, they have confirmed their findings with a panel-instrumental-variable analysis that utilizes the variation caused by BlackRock's acquisition of Barclays Global Investors in 2009. They conclude that, while enabling private benefits such as diversified low-cost investment, common ownership by large asset managers leads to decreased macroeconomic efficiency through reduced product market competition and thus has significant hidden social costs.
Another study on banking competition in the United States has found that common ownership by asset managers and cross-ownership (the situation in which banks own shares in each other) are strongly correlated with higher client fees and higher deposit rate spreads.Footnote 57 An additional study, using the variations in ownership by passive funds that are due to the inclusion of stocks in the Russell 1,000 and 2,000 indices, found that index funds influence the corporate governance of firms, leading to more independent directors and the removal of takeover defenses.Footnote 58
These findings support the thesis that the Big Three may exert structural power over hundreds, if not thousands, of publicly listed corporations in a way that is “hidden” from direct view. In most cases, BlackRock, Vanguard, and State Street need not overtly enforce their opinion on firms by voting against management, because it is rational for managers to act in a way that conforms to the interests of the Big Three. The large and growing concentration of ownership of the Big Three together with their centralized corporate governance strategies we uncovered underscores the importance of a research agenda that further investigates the consequences of this form of new finance capitalism where passive asset managers occupy positions of structural prominence.
6 Asset management capitalism and new financial risk
The recent rise of the Big Three has already led to serious concerns that “it cannot be good for capitalism.”Footnote 59 A first and major concern is that a further increasing market share of passive index funds could impair efficient price finding on equity markets, as the proportion of actively traded shares would continue to shrink. This concern already led some to polemically argue that because passive funds take active fund managers out of the role of allocating capital, the outcome is “stealth socialism.”Footnote 60 One of the most outspoken regulators concerning this topic is Andrew Haldane from the Bank of England. In a speech in 2014, he argued that we have potentially entered the “age of asset management” due to enormous growth of assets under management in the last decades and the relative retreat of banks after the global financial crisis.Footnote 61 He sees indications that passive investing could increase investor herding and thus lead to more correlated movements of markets. In this way, passive index funds could intensify the pro-cyclicality of financial markets.
A second concern regarding increased risk relates to the practice of securities lending. Passive asset managers regularly lend out shares to short-sellers to generate additional income. According to Cetorelli, BlackRock has increased its securities lending operations significantly in recent years. Indemnification of securities on loan by BlackRock more than tripled from U.S. $40 billion in 2012 to over U.S. $130 billion in 2014, while for State Street the value was even U.S. $320 billion one year before.Footnote 62 Such securities lending—like most activities of large passive asset managers—seems to be unproblematic in good times, but could impair liquidity significantly in times of serious market stress. These developments have led global regulators to examine whether large asset managers, such as BlackRock, should be labeled “systemically-important financial institutions.” In mid-2015, the Financial Stability Board in Basel decided not (yet) to apply this label—after fierce lobbying by the industry.Footnote 63 On the other hand, concerns about reduced liquidity due to passive investment strategies may be moderated by the observation that ETFs themselves have become the object of active trading strategies. The first passive stock tracker—the SPDR S&P 500 ETF—is the single most heavily traded listed security on the planet.Footnote 64
The active trading of passive index funds may have far reaching consequences. When passive index funds do indeed become the main building blocks for active investment, we are confronted with a fundamental reorganization of contemporary corporate governance. Because the voting rights reside with the asset managers who supply the passive index funds, and because the passive index fund industry is concentrated in the hands of the Big Three, this effectively means that the separation of ownership and control may potentially come to an end. After all, the active investors who trade with the passive building blocks no longer have access to the voting rights. And the Big Three accumulate the voting rights without much concern for short-term considerations. What is more, their interests are not restricted to the well-being of any particular firm. As mentioned, passive index fund managers arguably have little interest in fierce competition between their co-owned corporations, because this constitutes a zero-sum (or even negative-sum) game for them. Rather, they have industry or market-wide interests. Such developments may lead to a situation where the large owners of corporate businesses have limited incentives to engage with firm-level corporate governance beyond fulfilling their fiduciary obligations.
7 Conclusion
Since 2008, an unprecedented shift has occurred from active towards passive investment strategies. We showed that the passive index fund industry is dominated by BlackRock, Vanguard, and State Street. Seen together, these three giant, passive asset managers already constitute the largest shareholder in at least 40 percent of all U.S. listed companies and 88 percent of the S&P 500 firms. Hence, the Big Three, through their corporate governance activities, could already be seen as the new “de facto permanent governing board” for over 40 percent of all listed U.S. corporations.Footnote 65
An original and compressive mapping of blockholdings revealed that in the United States the market for corporate control shows unprecedented levels of concentrated corporate ownership. The Big Three occupy a position of “structural prominence” in this network of corporate governance. We furthermore found that while the proxy voting strategies of the Big Three show signs of coordination, they by and large support management. However, BlackRock, Vanguard, and State Street may be able to influence management through private engagements. Moreover, management of co-owned companies are well aware that the Big Three are permanently invested in them, which makes it possible that through this “disciplinary” effect they may internalize some common objectives of the passive index managers. On balance, we find significant indications that the Big Three might be able to exert forms of power over the companies held in their portfolios that are hidden from direct inspection.
When Vanguard pioneered its index fund concept in the mid-1970s it was attacked as “un-American,” exactly because they held shares in all the firms of an index and did not try to find the companies that would perform best. Therefore, the new tripartite governing board of BlackRock, Vanguard, and State Street is potentially conflicting with the image of America as a very liberal market economy, in which corporations compete vigorously, ownership is generally fragmented, and capital is generally seen as “impatient.”Footnote 66 Benjamin Braun has argued that passive investors may, in principle, act as “patient” capital and thus facilitate long-term strategies.Footnote 67 Hence, the Big Three have the potential to cause significant change to the political economy of the United States, including through influencing important topics for corporations, such as short-termism versus long-termism, the (in)adequacy of management remuneration, and mergers and acquisitions.
We reflected on a number of anticompetitive effects that come with the rise of passive asset management, which could have negative consequences for economic growth and even for economic equality. As well, we signaled how the continuing growth of ETFs and other passive index funds can create new financial risk, including increased investor herding and greater volatility in times of severe financial instabilities. The ongoing rise of the Big Three and the concomitant fundamental transformation of corporate ownership today clearly warrants more research to examine their impact on financial markets and corporate control—in the United States but also internationally.


 Open access