
Data plays a big part in machine learning.
It is important to understand and use the right terminology when talking about data.
In this post you will discover exactly how to describe and talk about data in machine learning. After reading this post you will know the terminology and nomenclature used in machine learning to describe data.
Kick-start your project with my new book Statistics for Machine Learning, including step-by-step tutorials and the Python source code files for all examples.
This will greatly help you with understanding machine learning algorithms in general.

How To Talk About Data in Machine Learning
Photo by PROWilliam J Sisti, some rights reserved.
Let’s get started.
Data As you Know It
How do you think about data?
Think of a spreadsheet, like Microsoft Excel. You have columns, rows, and cells.

Data Terminology in Data in Machine Learning
- Column: A column describes data of a single type. For example, you could have a column of weights or heights or prices. All the data in one column will have the same scale and have meaning relative to each other.
- Row: A row describes a single entity or observation and the columns describe properties about that entity or observation. The more rows you have, the more examples from the problem domain that you have.
- Cell: A cell is a single value in a row and column. It may be a real value (1.5) an integer (2) or a category (“red”).
This is how you probably think about data, columns, rows and cells.
Generally, we can call this type of data: tabular data. This form of data is easy to work within machine learning.
Need help with Statistics for Machine Learning?
Take my free 7-day email crash course now (with sample code).
Click to sign-up and also get a free PDF Ebook version of the course.
Data As It Is Known in Machine Learning
There are different flavors of machine learning that give different perspectives on the field. For example there is a the statistical perspective and the computer science perspective.
Next we will look at the different terms used to refer to data as you know it.
Statistical Learning Perspective
The statistical perspective frames data in the context of a hypothetical function (f) that the machine learning algorithm is trying to learn.
That is, given some input variables (input), what is the predicted output variable (output).
output = f(input)
Those columns that are the inputs are referred to as input variables.
Whereas the column of data that you may not always have and that you would like to predict for new input data in the future is called the output variable. It is also called the response variable.
output variable = f(input variables)
Statistical Learning Perspective
Typically, you have more than one input variable. In this case the group of input variables are referred to as the input vector.
output variable = f(input vector)
If you have done a little statistics in your past you may know of another more traditional terminology.
For example, a statistics text may talk about the input variables as independent variables and the output variable as the dependent variable. This is because in the phrasing of the prediction problem the output is dependent or a function of the input or independent variables.
dependent variable = f(independent variables)
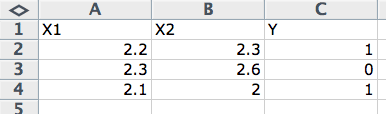
The data is described using a short hand in equations and descriptions of machine learning algorithms. The standard shorthand used in the statistical perspective is to refer to the input variables as capital “x” (X) and the output variables as capital “y” (Y).
Y = f(X)
When you have multiple input variables they may be dereferenced with an integer to indicate their ordering in the input vector, for example X1, X2 and X3 for data in the first three columns.
Computer Science Perspective
There is a lot of overlap in the computer science terminology for data with the statistical perspective. We will look at the key differences.
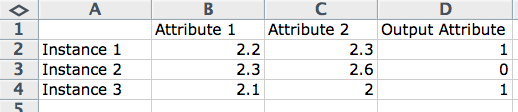
A row often describes an entity (like a person) or an observation about an entity. As such, the columns for a row are often referred to as attributes of the observation. When modeling a problem and making predictions, we may refer to input attributes and output attributes.
output attribute = program(input attributes)
Computer Science Perspective
Another name for columns is features, used for the same reason as attribute, where a feature describes some property of the observation. This is more common when working with data where features must be extracted from the raw data in order to construct an observation.
Examples of this include analog data like images, audio and video.
output = program(input features)
Another computer science phrasing is that for a row of data or an observation as an instance. This is used because a row may be considered a single example or single instance of data observed or generated by the problem domain.
prediction = program(instance)
Models and Algorithms
There is one final note of clarification that is important and that is between algorithms and models.
This can be confusing as both algorithm and model can be used interchangeably.
A perspective that I like is to think of the model as the specific representation learned from data and the algorithm as the process for learning it.
model = algorithm(data)
For example, a decision tree or a set of coefficients are a model and the C5.0 and Least Squares Linear Regression are algorithms to learn those respective models.
Summary
In this post you discovered the key terminology used to describe data in machine learning.
- You started with the standard understanding of tabular data as seen in a spreadsheet as columns, rows and cells.
- You learned the statistical terms of input and output variables that may be denoted as X and Y respectively.
- You learned the computer science terms of attribute, feature and instance.
- Finally you learned that talk of models and algorithms can be separated into learned representation and process for learning.
Do you have any questions about this post or about data terminology used in machine learning? Leave a comment and ask your question and I will do my best to answer it.
Get a Handle on Statistics for Machine Learning!

Develop a working understanding of statistics
...by writing lines of code in python
Discover how in my new Ebook:
Statistical Methods for Machine Learning
It provides self-study tutorials on topics like:
Hypothesis Tests, Correlation, Nonparametric Stats, Resampling, and much more...
Discover how to Transform Data into Knowledge
Skip the Academics. Just Results.


Boa noite!
Achei meio difícil de entender, eu sou novo nesta área estou estudando Python, para que eu consiga implementar um sistema de aprendizado em uma escola de química fazer um simulador de moléculas em Python , onde os alunos possa estudar partes por partes as moléculas, mais ainda estou com muitas duvidas, poucas pessoas estão dispostas a fazer isto comigo, ja ate pedi ajuda para governo mais sem respostas, e complicado mais para colocar uma ideia em pratica no brasil e muito difícil ainda..
Sorry to hear that, hang in there.
My best advice for getting started is here:
https://machinelearningmastery.com/start-here/
Also, some of the FAQs here may help:
https://machinelearningmastery.com/faq/
Hello. Thank you for all the good articles. I have a question regarding the matrix representation that derives from the chosen terminology. If I represent rows V as entities and columns M as attributes of a specific entity, and create this VxM matrix, is there a difference if a choose to analyze it conversely, as a MxV matrix? Meaning, in the first case I would think of |M| points located in a |V|-dimensional space; while in the second case I would think of |V| points located in |M|-dimensional space (considering that each column is a point). Is there a difference for example if I choose to run clustering on one versus the other?
Thanks!
You’re welcome.
Good question. Yes it matters from our modeling perspective, but less so from the math – it does’t care.
Perhaps some of these tutorials will help:
https://machinelearningmastery.com/start-here/#linear_algebra
Thank you for the response. I will check them out.
You’re welcome.