Day Return
YTD Return
1-Year Return
3-Year Return
5-Year Return
Note: Sector performance is calculated based on the previous closing price of all sector constituents
Industries in This Sector
Select an Industry for a Visual Breakdown
| Industry | Market Weight | Day Return | YTD Return |
|---|---|---|---|
| All Industries | 100% | 0.10% | 12.01% |
| Oil & Gas Integrated | 36.50% | 0.19% | 13.77% |
| Oil & Gas E&P | 26.25% | 0.14% | 14.64% |
| Oil & Gas Midstream | 20.20% | -0.06% | 8.16% |
| Oil & Gas Refining & Marketing | 7.65% | -0.02% | 16.23% |
| Oil & Gas Equipment & Services | 7.10% | 0.11% | 3.79% |
| Uranium | 1.07% | -0.18% | 11.97% |
| Oil & Gas Drilling | 0.92% | -0.08% | 1.12% |
| Thermal Coal | 0.31% | -0.11% | -8.39% |
Note: Percentage % data on heatmap indicates Day Return
All Industries
-
Largest Companies in This Sector
|
Name
|
Last Price
|
1Y Target Est.
|
Market Weight
|
Market Cap
|
Day Change %
|
YTD Return
|
Avg. Analyst Rating
|
|---|---|---|---|---|---|---|---|
| 117.96 | 130.84 | 18.81% |
|
|
|
Buy
|
|
| 165.89 | 180.98 | 12.34% |
|
|
|
Buy
|
|
| 130.24 | 143.48 | 6.15% |
|
|
|
Buy
|
|
| 135.70 | 145.93 | 3.15% |
|
|
|
Buy
|
|
| 198.39 | 218.50 | 2.88% |
|
|
|
Buy
|
|
| 49.20 | 67.39 | 2.83% |
|
|
|
Buy
|
|
| 151.41 | 169.01 | 2.59% |
|
|
|
Buy
|
|
| 29.06 | 32.82 | 2.54% |
|
|
|
Buy
|
|
| 268.87 | 274.81 | 2.53% |
|
|
|
Hold
|
|
| 67.78 | 72.29 | 2.42% |
|
|
|
Hold
|
Investing in the Energy Sector
Start Investing in the Energy Sector Through These ETFs and Mutual Funds
ETF Opportunities
|
Name
|
Last Price
|
Net Assets
|
Expense Ratio
|
YTD Return
|
|---|---|---|---|---|
| 95.74 | 39.708B | 0.09% |
|
|
| 133.49 | 10.625B | 0.10% |
|
|
| 47.52 | 8.423B | 0.85% |
|
|
| 157.02 | 4.218B | 0.35% |
|
|
| 44.08 | 3.36B | 0.44% |
|
Mutual Fund Opportunities
|
Name
|
Last Price
|
Net Assets
|
Expense Ratio
|
YTD Return
|
|---|---|---|---|---|
| 66.70 | 10.625B | 0.10% |
|
|
| 91.93 | 5.738B | 0.38% |
|
|
| 48.99 | 5.738B | 0.38% |
|
|
| 6.12 | 3.701B | 6.31% |
|
|
| 5.76 | 3.701B | 6.31% |
|
Energy Research
Discover the Latest Analyst and Technical Research for This Sector
-
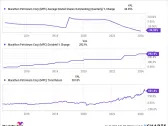
Analyst Report: Weatherford International plc
Weatherford International provides diversified oilfield services across international markets for an array of oilfield types. The firm is a global market leader in artificial lift and tubular running services. Other key product lines include cementing products, directional drilling, and wireline evaluation.
RatingPrice Target -
Analyst Report: NOV Inc.
NOV (formerly National Oilwell Varco) is a leading supplier of oil and gas drilling rig equipment and products, such as downhole tools, drill pipe, and well casing. The company operates on a global scale, with international markets contributing more than 60% of its annual revenue.
RatingPrice Target -
Analyst Report: Exxon Mobil Corporation
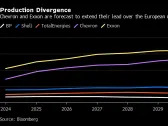
ExxonMobil is an integrated oil and gas company that explores for, produces, and refines oil around the world. In 2023, it produced 2.4 million barrels of liquids and 7.7 billion cubic feet of natural gas per day. At the end of 2023, reserves were 16.9 billion barrels of oil equivalent, 66% of which were liquids. The company is one the world's largest refiners with a total global refining capacity of 4.5 million barrels of oil per day and is one of the world's largest manufacturers of commodity and specialty chemicals.
RatingPrice Target -
Analyst Report: TotalEnergies SE
TotalEnergies is an integrated oil and gas company that explores for, produces, and refines oil around the world. In 2023, it produced 1.6 million barrels of liquids and 5.0 billion cubic feet of natural gas per day. At end-2022, reserves stood at 10.2 billion barrels of oil equivalent, 56% of which are liquids. During 2023, it had LNG sales of 44.3 metric tons. The company owns interests in refineries with capacity of nearly 2.0 million barrels a day, primarily in Europe, distributes refined products in 65 countries, and manufactures commodity and specialty chemicals. At year-end, its gross installed renewable power generation capacity was 22.4 gigawatts.
RatingPrice Target