
March 22, 2023
The Fed Is Broke” – Gundlach Likes Gold, Fears “Expanding Wars” Most
In the past week, DoubleLine CEO and founder Jeffrey Gundlach has had a lot to say as the US banking system collapse and bailout enjoins Europe’s banking crisis leaving central banks’ inflation-fighting plans in question.
The ECB was clear – hiking 50bps and FTW! – but what will The Fed do?
The market has dovishly adjusted to the banking crisis overhang… (pricing in a peak in rate in May with just one 25bps hike and then cuts for the rest of the year)
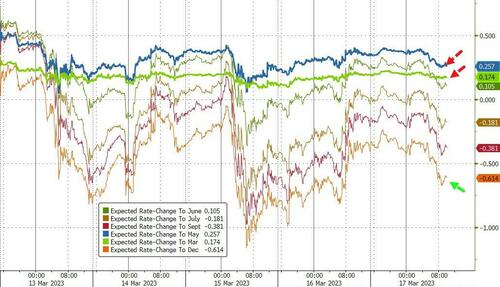
…and the new ‘bond king’ suggests that Powell hikes continue to keep up its inflation-fighting efforts, due to credibility concerns.
“This is really throwing a wrench in [Fed Chair] Jay Powell’s game plan,” Gundlach said.
“I wouldn’t do it myself. But what do you do in the context of all this messaging that has happened over the past six months, and then something happens that you think you’ve solved.”
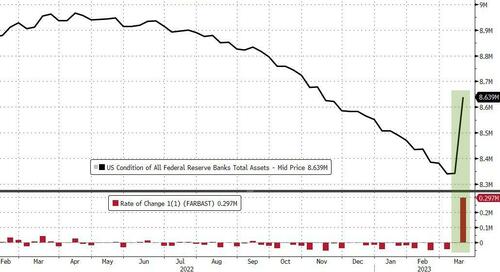
Ironically adding that, The Fed is doing this with one hand at the same time as enabling inflationary policy with the BTFP on the other:
“I think that the inflationary policy is back in play with the Federal Reserve … putting money into the system through this lending program.” Gundlach said.
But, in a Twitter Spaces audio chat Thursday with Jennifer Ablan, editor-in-chief of Pensions & Investments, Gundlach warns of an imminent recession – within the next four months – as the yield-curve suddenly steepens…
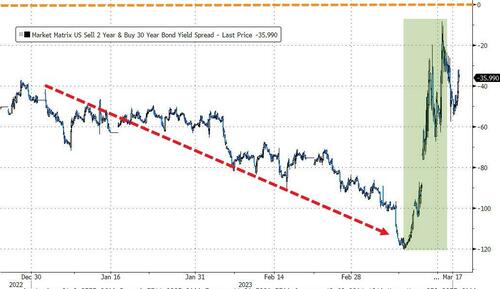
“In all the past recessions going back for decades, the yield curve starts de-inverting a few months before the recession,” adding that “I think it’s within four months at the most. Almost every indicator is flipped into high probability. The only one that hasn’t is the unemployment rate.”
But,, the DoubleLine founder pointed out that at 3.6%, the unemployment rate just crossed back above its 12-month moving average…
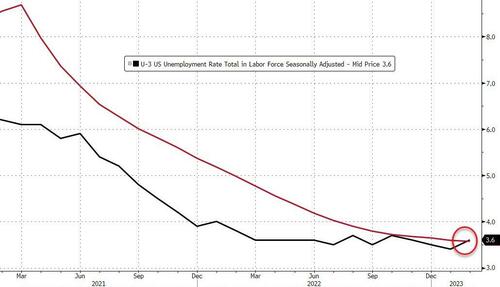
Which, historically has been “a reliable indicator you’re on the doorstep” of recession.
Gundlach called Silicon Valley Bank’s failure “a rate policy collision with stupid accounting rules” for banks, but warned of The Fed’s reaction was inflationary and antithetical to their inflation-fighting stance.
“By bailing out depositors at SVB, that’s essentially a quantitative easing” by the Fed, he said.
“Making those depositors whole is about the same as a month or two of reversing quantitative tightening.”
The stock market is currently in a bear market, he said, and he would sell into any rallies.
Gundlach predicts the S&P 500 index will trade down to 3,200 and reminded investors that “the goal for 2023 is survival, and losing as little money as possible.”
What worries the bond king the most may surprise some – spreading geopolitical conflicts:
“I think expanding wars worries me the most.”
But he was clear on the biggest financial risk:
“The Fed is broke. The Fed’s balance sheet is negative $1.1 trillion. There’s nothing they can do to fight any problems except for printing money.
They have nothing left. The Fed used to send money to Treasury. Now Treasury sends money to the Fed.
We’re at this point in time where we don’t have any road left to kick the can on our mismanagement of finances and monetary policy.”
His suggestion – buy gold.
If government spending continues, he predicts “the dollar will collapse under the weight of the deficit.”
“I think gold is a good long-term hold, gold and other real assets with true value, such as land, gold and collectibles.”
Iran-Saudi Rapprochement Will Deal A Deathblow To The Dollar
Authored by Andrew Korybko via The Automatic Earth blog,
Eurasia’s geo-economic integration took a great leap forward as a result of the Iranian–Saudi rapprochement, which unlocks the Gulf Cooperation Council’s (GCC) trade potential with Russia and China. Its wealthy members can now tap into two series of Iranian-transiting megaprojects in one fell swoop through this deal, with the North-South Transport Corridor (NSTC) connecting them to Russia while the China-Central Asia-West Asia Economic Corridor (CCAWAEC) will do the same vis-à-vis China.

The bloc’s de facto Saudi leader has been prioritizing a comprehensive economic reform policy known as “Vision 2030” that was introduced by Crown Prince and first-ever Prime Minister Mohammed Bin Salman (MBS) upon his rise to power in 2015. It regrettably stumbled as a result of the disastrous Yemeni War that he’s been waging since that same year, but everything is now back on track and more promising than ever after securing $50 billion worth of investments from China last December.
The People’s Republic regards Vision 2030 as complementary to its Belt & Road Initiative (BRI) due to MBS’ focus on real-sector investments for preemptively diversifying the Saudi economy away from its presently disproportionate dependence on oil exports. His country’s location at the crossroads of Afro-Eurasia also makes investments there extremely attractive from the perspective of China’s logistical interests, hence its massive commitment to his comprehensive economic reform policy.
Without last week’s Beijing-brokered deal, China would have had to rely on maritime routes under the control of the powerful US Navy to facilitate the forthcoming explosion in bilateral real-sector trade, but now everything can be conducted much more securely via the Iranian-transiting CCAWAEC. Looking forward, there’s also a theoretical possibility of Chinese energy investments in Iran connecting the Gulf to Central Asia and thenceforth to the People’s Republic, thus fully securing its strategic interests.
That’s still a far way’s off, if it even happens at all that is, but it nevertheless can’t be ruled out. Saudi Arabia’s desire to join BRICS and the SCO, which are the most influential multipolar organizations in the world right now, could turn this scenario into a reality a lot sooner than even the most optimistic observers might have expected. All of this in and of itself will herald a revolution in geo-economic affairs, and that’s even without Saudi Arabia having yet to throw its full support behind the “petroyuan”.
Once this major oil exporter begins to sell its resources in non-dollar-denominated currencies like China’s, then the petrodollar upon which the economic-financial aspect of the US’ unipolar hegemony is predicated will be dealt a deathblow. The global systemic transition to multipolarity and the impending trifurcation of International Relations that will precede the final inevitable form of this process would unprecedentedly accelerate once this happens, thus further hastening America’s ongoing demise.
About those aforementioned processes, they were already made irreversible by the special operation that Russia was forced to commence in defense of its national security red lines in Ukraine after NATO clandestinely crossed them there and subsequently rejected Moscow’s security guarantee requests for politically resolving their resultant security dilemma. Over the past year, the New York Times was forced to admit that not only did the sanctions fail, but even the plot to “isolate” Russia did too.
These outcomes were largely the result of Russia’s example inspiring the Global South to rise up against neo-colonialism by refusing to comply with the demands placed upon them by the US-led West’s Golden Billion to unilaterally sacrifice their own interests simply to serve that de facto New Cold War bloc’s. India played the leading role in this respect due to its status as the world’s largest developing country, which gave comparatively medium- and smaller-sized ones the confidence to follow in its footsteps.
That globally significant Great Power, which sits on the South Asian end of the NSTC that transits through Iran en route to Russia, also scaled up its purchases of discounted oil from Moscow to the point where its decades-long strategic partner is nowadays its largest supplier. Of crucial significance to the present analysis, a growing number of its deals are in non-dollar-denominated currencies, which sped up de-dollarization processes to such an extent that even Reuters felt compelled to write about this.
Considering this newfound financial context, there’s no doubt that upcoming Saudi moves in support of the petroyuan that are taken in coordination with Iran and Russia would catalyze the next natural phase of de-dollarization. Russian-GCC real-sector trade that’ll be carried out via Iran across the NSTC will be conducted in national currencies and thus prepare those three for the moment when they finally decide to deal a deathblow to the petrodollar.
All in all, it’s not hyperbole to declare that the dollar’s prior dominance is done for as a result of the Iranian-Saudi rapprochement. That Beijing-brokered deal makes this outcome an inevitability unless some subversive black swan event takes place such as a US-backed coup against MBS, though that’s unlikely to happen after he successfully consolidated his power in late 2017. With this in mind, it can confidently be declared that that last week’s development will be seen in hindsight as a game-changer.
Visualizing 30 Years Of Central Bank Gold Demand
Did you know that nearly one-fifth of all the gold ever mined is held by central banks?
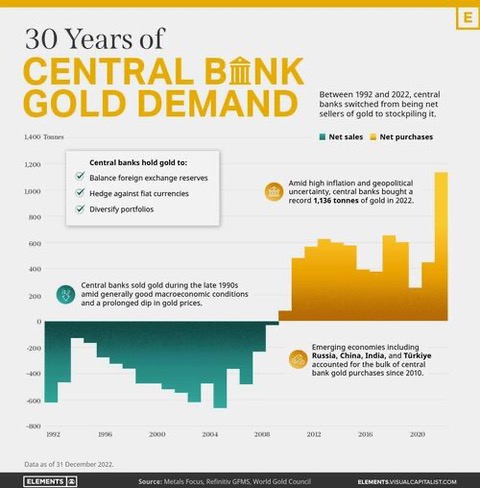
As Visual Capitalist’s Govind Bhutada details below, besides investors and jewelry consumers, central banks are a major source of gold demand. In fact, in 2022, central banks snapped up gold at the fastest pace since 1967.
However, the record gold purchases of 2022 are in stark contrast to the 1990s and early 2000s, when central banks were net sellers of gold.
The above infographic uses data from the World Gold Council to show 30 years of central bank gold demand, highlighting how official attitudes toward gold have changed in the last 30 years.
Why Do Central Banks Buy Gold?
Gold plays an important role in the financial reserves of numerous nations. Here are three of the reasons why central banks hold gold:
The Switch from Selling to Buying
In the 1990s and early 2000s, central banks were net sellers of gold.
There were several reasons behind the selling, including good macroeconomic conditions and a downward trend in gold prices. Due to strong economic growth, gold’s safe-haven properties were less valuable, and low returns made it unattractive as an investment.
Central bank attitudes toward gold started changing following the 1997 Asian financial crisis and then later, the 2007–08 financial crisis. Since 2010, central banks have been net buyers of gold on an annual basis.
Here’s a look at the 10 largest official buyers of gold from the end of 1999 to end of 2021:
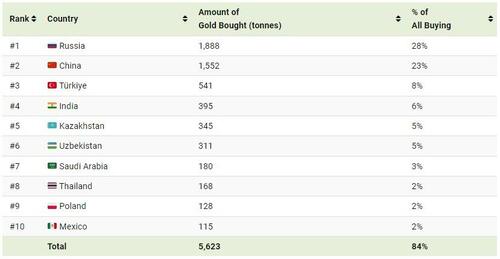
Source: IMF
The top 10 official buyers of gold between end-1999 and end-2021 represent 84% of all the gold bought by central banks during this period.
Russia and China—arguably the United States’ top geopolitical rivals—have been the largest gold buyers over the last two decades. Russia, in particular, accelerated its gold purchases after being hit by Western sanctions following its annexation of Crimea in 2014.
Interestingly, the majority of nations on the above list are emerging economies. These countries have likely been stockpiling gold to hedge against financial and geopolitical risks affecting currencies, primarily the U.S. dollar.
Meanwhile, European nations including Switzerland, France, Netherlands, and the UK were the largest sellers of gold between 1999 and 2021, under the Central Bank Gold Agreement (CBGA) framework.
Which Central Banks Bought Gold in 2022?
In 2022, central banks bought a record 1,136 tonnes of gold, worth around $70 billion.
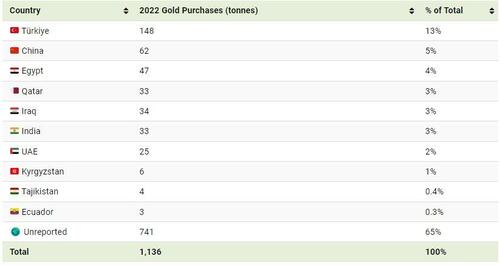
Türkiye, experiencing 86% year-over-year inflation as of October 2022, was the largest buyer, adding 148 tonnes to its reserves. China continued its gold-buying spree with 62 tonnes added in the months of November and December, amid rising geopolitical tensions with the United States.
Overall, emerging markets continued the trend that started in the 2000s, accounting for the bulk of gold purchases. Meanwhile, a significant two-thirds, or 741 tonnes of official gold purchases were unreported in 2022.
According to analysts, unreported gold purchases are likely to have come from countries like China and Russia, who are looking to de-dollarize global trade to circumvent Western sanctions.
- Balancing foreign exchange reserves
Central banks have long held gold as part of their reserves to manage risk from currency holdings and to promote stability during economic turmoil. - Hedging against fiat currencies
Gold offers a hedge against the eroding purchasing power of currencies (mainly the U.S. dollar) due to inflation. - Diversifying portfolios
Gold has an inverse correlation with the U.S. dollar. When the dollar falls in value, gold prices tend to rise, protecting central banks from volatility.
Three Charts Every Trader Needs to See Today
By Graham Summers, MBA
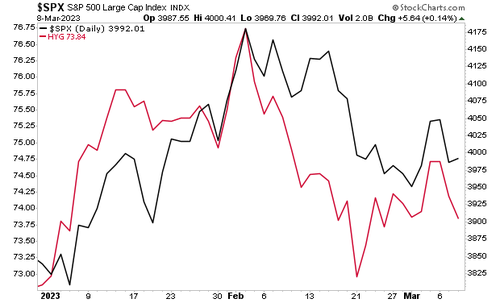
High yield credit is turning back down again.

This is a big deal as historically high yield credit leads stocks.
Indeed, high yield credit bottomed in October 2022 (purple circle in the chart below) a full two weeks before stocks did (blue circle in the chart below).
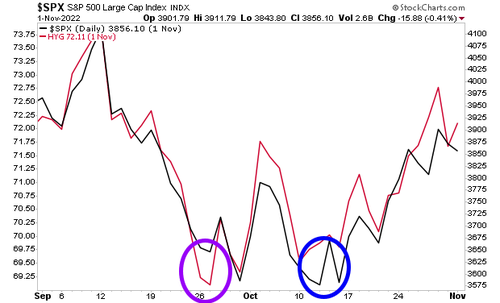

Now high yield credit is telling us stocks are set to drop. According to high yield credit, the S&P 500 should already be at 3,900 a full 100 points lower.

Oh… and by the way… our proprietary Bear Market Trigger… the one that predicted the Tech Crash as well as the Great Financial Crisis… is on a confirmed SELL signal for the first time since 2008.
If you’ve yet to take steps to prepare for what’s coming, we just published a new exclusive special report How to Invest During This Bear Market.
It details the #1 investment to own during the bear market as well as how to invest to potentially generate life changing wealth when it ends.
The Rout In Two-Year Treasuries May Be Just Getting Started
Authored by Ven Ram, Bloomberg cross-asset strategist,
Back in October, we contended that Treasury two-year yields would surge past 5%.
For a time after after that – especially from November through January – it seemed the market winds had changed direction.
But after Fed Chair Jerome Powell vowed to re-accelerate the pace of tightening, the bearish mood was in full display, sending the two-year Treasury yield past 5%.
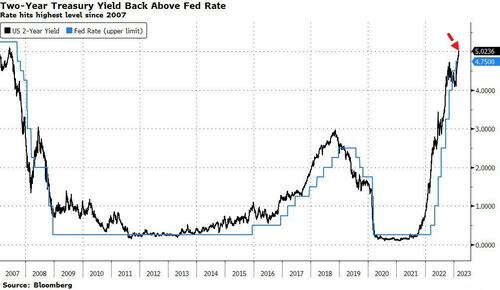

It wasn’t, therefore, any surprise to see stocks slump, the dollar flex its muscles and gold tumble.
But the most important reaction was the surge in US real rates, which has key implications for pretty much every asset.

Still, this movie may have some way to go (h/t to Daniel Curtis for chart).
Here’s why: the tell-tale three-month/10-year Treasury curve has been in a consistent inversion since November, and typically, recessions have followed between 11 and 14 months.
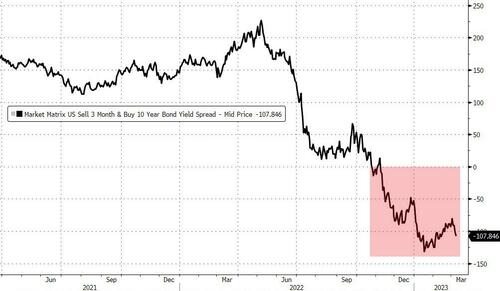
That would suggest that any inflection point in the US economy may be unlikely before October at the earliest – meaning the Fed may be raising rates all through the summer. That may mean that a 6% terminal rate is no longer just a tail risk but a real prospect.
Not that it’s all going to be a one-way street as there are bound to be potholes along the way.
We got the ADP payrolls data earlier today (stronger than expected), JOLTS (stronger than expected), and the non-farm payrolls print later this week, which will confirm whether January’s breakneck expansion was a blip or a trend.
There used to be a time when the outcome of non-farm payrolls had some meaningful correlation – at least from a classic statistical standpoint – with the ADP data, but in the post-pandemic world the explanatory power of the latter has almost completely evaporated.
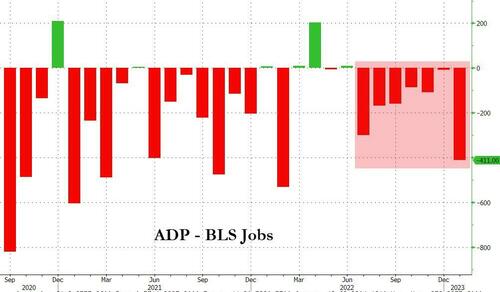

However, the takeaway being that today’s upside ADP and JOLTS prints confirm the market’s worst fears on the Fed trajectory, with traders still hanging onto their hats until we have the non-farm payrolls number.
[ZH: As an aside, Eurodollar options traders have a number of bets out there for rates being 6% or above by September…]
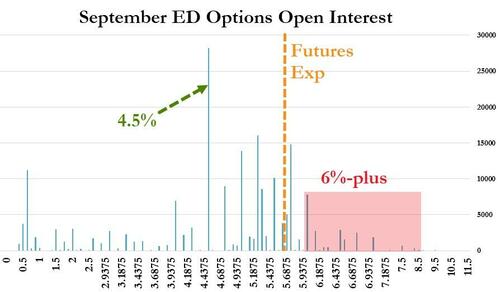

Do we think the equity market can handle that?
300 Billion Reasons Why SVB Contagion Is Spreading To The Broader Banking System
Update 12:00pm ET: Silicon Valley Bank has been shuttered by California regulators, who have appointed a receiver (more here).
All insured depositors will have full access to their insured deposits no later than Monday morning, March 13, 2023. The FDIC will pay uninsured depositors an advance dividend within the next week. Uninsured depositors will receive a receivership certificate for the remaining amount of their uninsured funds. As the FDIC sells the assets of Silicon Valley Bank, future dividend payments may be made to uninsured depositors.
This will hardly boost depositor confidence in other small banks and, by extension, big ones.
* * *
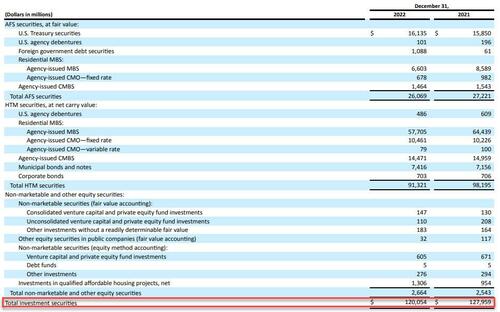
For those who slept through yesterday, here is what you missed and why the US banking system is suffering its worst crisis since 2020. Silicon Valley Bank, aka SIVB, the 18th largest bank in the US with $212 billion in assets of which $120 billion are securities (of which most or $57.7BN are Held to Maturity (HTM) Mortgage Backed Securities and another $10.5BN are CMO, while $26BN are Available for Sale, more on that later )…
… funded by over $173 billion in deposits (of which $151.5 billion are uninsured), has long been viewed as the bank at the heart of the US startup industry due to its singular focus on venture-capital firms. In many ways it echoes the issues we saw at Silvergate, which banked crypto firms almost exclusively.
SIVB stunned markets on Thursday after it announced a series of actions to improve its balance sheet flexibility and capital ratios as rates potentially remain higher-for-longer and private markets remain under pressure. Note: while many had speculated that the bank may be facing a liquidity crisis in a rapidly rising rate environment (most notably the WSJ in late 2022), it took the management team’s confirmation that liquidity has collapsed to spark a bank crisis and a depositor run. The bank said it sold $21 billion of its available for sale (AFS) securities to be reinvested into shorter-duration Treasuries, and publicly announced raising $2.25 bil of equity ($1.75 bil common and $0.5 bil pref) primarily to support its capital ratios given the $1.8 bil after-tax loss it expects to realize on the sale and also partly to help support its credit rating. We now know, courtesy of CNBC reporting, that this equity raise failed and the bank is instead is trying to sell itself to a bigger bank.
Why did SIVB do this? Well, according to Morgan Stanley’s Manan Gosalia, who as of yesterday was the only sellside analyst to have a Sell rating on the company with a $190 price target…
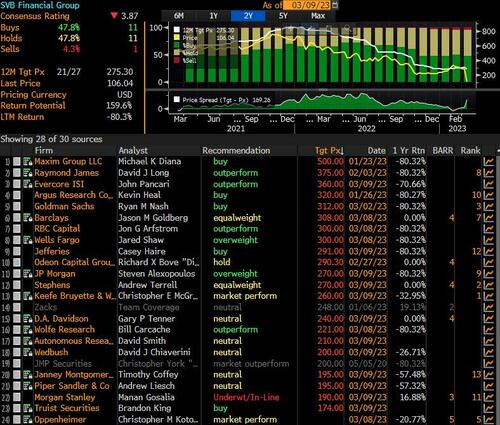
… the bank did not intend to spark a panic but instead “these actions enhance its balance sheet flexibility as rates move higher. By selling down its existing AFS portfolio, which had a duration of 3.6 years, and reinvesting the proceeds into short-term US Treasurys, SIVB is enhancing its liquidity position and NIM protection as rates continue to rise. The bank is also terming out its funding by adding $15 bil of longer-dated borrowings and hedging to protect against further increases in rates. All in, the bank estimates that it will flip to asset sensitive with each 25 bp increase in rates driving $50-60 mil of higher NII.“
In English? The bank had a lot of fixed-rate TSY (and other) exposure that was underwater and carrying an unrealized loss, and having concluded that rates will keep rising, the bank decided to restructure its assets and flip its portfolio from a fixed-rate one (where rate hikes cause even more capital losses) to a short-term one (where they lead to modest NIM gains). Of course, the transition ended up costing the bank billions.
None of this is shocking, and yet the market was clearly surprised. Why?
For the answer we have to go all the way back to the immediate aftermath of the last financial crisis, when in early 2009 US regulators suspended Mark to Market, and instead of having banks hold debt securities on their books at price, they allowed them to split their asset holdings into two components: Available for Sale (or AfS), a bucket which would be marked to market and which could be sold to short up liquidity, and Held to Maturity (or HTM), a (far larger bucket) which allowed the banks to keep debt securities at cost.
This was created to avoid cross-selling contagion if one bank was forced to liquidate securities and infect other holders of the same security. In other words, it was purely a idiosyncratic feature, not one that was meant to offset macro conditions. And understandably so: in a time of raging deflation, and ZIRP and QE, when rates would seemingly never go up, virtually nobody even considered a scenario when it would be the Fed itself that would force rates higher to fight galloping inflation.
Sadly for SIVB, that’s where we are now, and the Fed’s rate hikes have manifested in two ways.
- First, rising rates afford depositors a completely risk-free way of parking your money at Treasuries without taking on company-specific deposit risk. This is a big issue for SIVB because as noted above it has $170BN in deposits.
- Second, rising rates force the bank to sweep ever bigger losses on its debt assets under the rug. And yes, while the bank can hide behind the “held at cost” basis afforded by Held to Maturity, the fact that the bank’s HTB book was of relatively moderate duration meant that even if it held to maturity, it would still suffer losses, which is why it proceeded with the previously discussed balance sheet restructuring.
The funny part, of course, is that we knew all of this!
Yes, both SEC and FDIC regulators require banks to disclose not only the value of their HTM assets, but also the fair value of said assets, with the fair value being – as the name implies – the value of the HTM assets if they were to be sold today. The delta between the two is what is known as “net unrealized loss” and it is rapidly emerging as the most important indicator of bank health.
To be sure, until recently nobody cared about net unrealized losses on bank portfolios because, well, there simply weren’t any. But once the rate hikes started and debt prices – for anything from Treasurys, to MBS, to CRE – to started to tumble, the unrealized losses started to climb, and nowhere is this more visible than in Silicon Valley Bank’s own balance sheet, where from virtually no losses a year ago, the number climbed to $16 billion as of Q3.
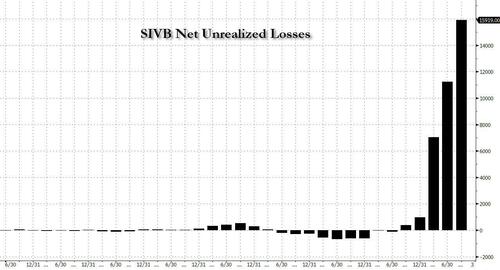
Now this is a problem because at the same time, its total shareholder equity was $15.8 billion. This means that quietly, all of the bank’s book equity had been wiped out simply by the accumulated – but not marked – losses on SIVB’s HTM portfolio.

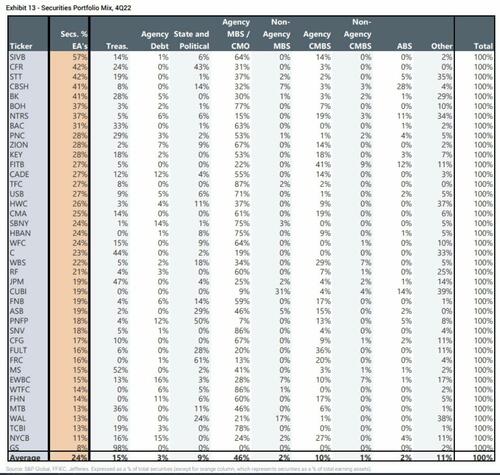
In some ways, SIVB was unique: while all US banks parked a chunk of their money in Treasuries and other bonds that dropped in value last year, SVB took it to a different level: its investment portfolio swelled to 57% of its total assets. No other competitor among 74 major US banks had more than 42%.
And here lies the rub: if it was only SIVB that has an “unrealized loss” problem then there would be no contagion, and the rest of the banking sector would be safe and sound. Unfortunately, as explained, the reason why SIVB’s HTM book blew up is because of surging rates, which is also why SIVB proceeded to liquidate its Available for Sale securities (at $26BN these are far less than the $91.3BN in HTM book). And it’s also why every other bank is now suffering under the pressure of massive “net unrealized losses.”
Presenting Exhibit A: net unrealized losses for the Big 4 banks.
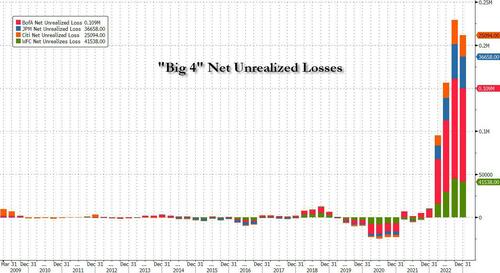
Just like SVB, the unrealized loss issue emerged only in 2022 when rates exploded and prices of debt securities tumbled. What stands out here is that while all banks have substantial exposure – the total is $250BN as of Dec 31, 22 – Bank of America has the most exposure at just under $110 billion.
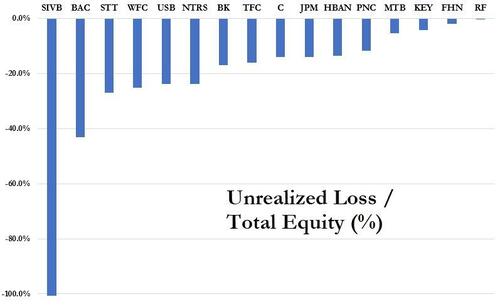
And another problem: these amounts may not sound like a lot, but when expressed in terms of book shareholder value for any given bank, they are staggering. The next chart shows what the net unrealized losses is when expressed as a function of total equity. Yes, SIVB is by far the worst with all of its book value wiped out by the unrealized loss, but other banks are hardly doing much better, to wit: Bank of America’s unrealized loss (i.e., the market-value gap between its HTB book and fair value) represents 43% of combined total equity; at State Street it is 27%; at Wells it is 25%, at US Bancorp it is 24% and so on…
Incidentally, for those asking, here is Bank of America’s commercial credit exposure by industry.
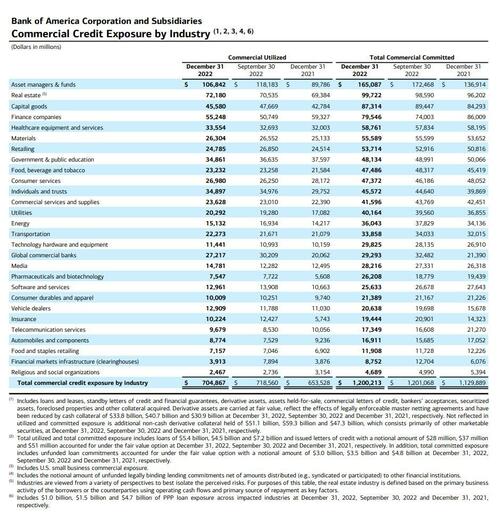
Extending this analysis to all 15 of the 24 KBW index members, the “fair value” gaps were equivalent to 10% of their equity or more. And cumulatively for all 24 banks, the $300 billion difference between the bonds’ book value and market value represented 22% of their $1.39 trillion of combined total equity!
Still think there won’t be contagion?
To be sure, some do: take Morgan Stanley’s Manan Gosalia (who as noted above was the sole SIVB sell rating before yesterday’s implosion), who this morning said that “the funding pressures facing SIVB are highly idiosyncratic and should not be viewed as a read-across to other regional banks.” He continues:
SIVB primarily banks technology, life science, and healthcare companies and is an integral part of the VC ecosystem. Falling VC funding activity and elevated cash burn are idiosyncratic pressures for SIVB’s clients, driving a decline in total client funds and on-balance-sheet deposits for SIVB. That said, we have always believed that SIVB has more than enough liquidity to fund deposit outflows related to venture capital client cash burn. SIVB has $15B in cash, $25B in newly repositioned short-dated securities, $73B in off-balance-sheet sweep accounts and repo funds that can be brought on balance sheet, and $65B in borrowing capacity (FHLB and Repo). This totals to ~$180B in available liquidity, relative to $165B of on-balance-sheet deposits. Our Underweight rating on the stock reflects that some of these sources of liquidity (particularly sweep accounts and wholesale borrowings) are expensive in a higher-for-longer rate environment, and represent a drag to earnings until the VC funding environment improves.
There is more in the full note (which is a must read for anyone involved in this situation and is available to pro subs), but Gosalia’s thesis is that while “the stock reactions across the group show that investors are worried about liquidity across the banking space” he does not “believe there is a liquidity crunch facing the banking industry, and most banks in our coverage have ample access to liquidity. As we have said before, the headwind for the banking industry is that the cost of liquidity is high and rising, which we have been tracking with our bi-weekly deposit tracker. This is a headwind for net interest margins, revenue and EPS.” (again, more in the full note available to pro subs).
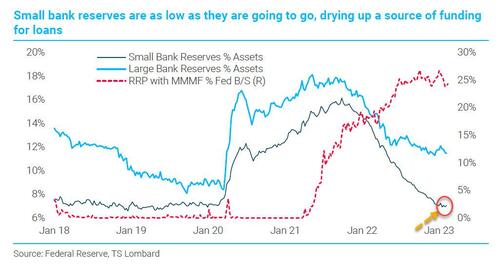
Perhaps he is right (one can’t forget that Manan is just a little conflicted, being employed by – well – a bank. But what we would counter with is that while he may well be right and contragion risk is modest for big banks, which thanks to the Fed’s massive post-covid QE are still drowning in reserves and have trillions in excess liquidity, the same can not be said for small banks. And the reason for that, as we explained in “Why Small Banks Are In Big Trouble: As Hedge Funds Pile Into The New “Big Short”, The Next ‘Credit Event’ Emerges“ is that not only do small banks have much more exposure to commercial real estate, and especially the office sector, but as TS Lombard showed, they are – unlike their bigger peers – now reserve constrained.
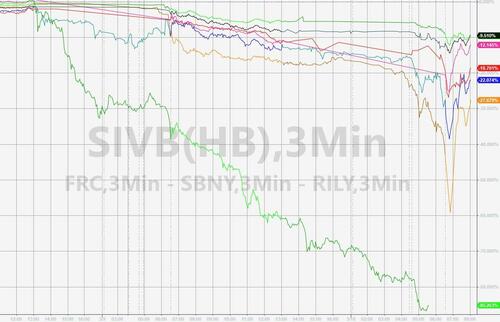
Which boils down to the following: if depositor confidence in the regional/small bank sector is now shot – and after both Silvergate and SIVB it very well may be – we will see a small (to medium if not larger) deposit run among the regionals which could prove devastating for these reserve-constrained banks which will need to scramble to raise capital a la SIVB in what eventually transforms into a death spiral for the sector, especially if depositors take one look at what is going on with regional bank prices – which have been in freefall in the past two days – and extrapolate what may come next – there’s a reason why banking is the ultimate confidence game.
There is one way to short-circuit this process and it, of course, involves the Fed which would need to step in the way it did in September 2019 when it was the big banks – namely JPMorgan – that were reserve-constrained, and forced the Fed to launch “Not QE” (but only after the US repo market suffered some historic rollercoaster moves). Ironically, even if the Fed does somehow whisper words of reassurance, the question is why would depositors park their money at “suddenly” risky banks when they can just buy a 6M T-Bill and get the same return with zero risk.
Yes, the Fed may have no choice but to cut rates if it wishes to save the (regional) banking system. But then again, the Fed is still stuck fighting runaway inflation, which means that Powell is now trapped, and as we tweeted previously, Powell is now trapped: More hikes: regional banks collapse; Less hikes: inflation target must be raised.
So will Powell let America’s small, regional banks risk failure as a result of his rate hikes (an outcome the likes of JPMorgan would find quite beneficial as it will make them even bigger), or will the Fed chair step in the way he did in 2019 even if it means gambling with runaway inflation? The right answer to that question could make some traders extremely rich.
“Mood No Longer Apocalyptic”: Wall Street’s Most Accurate Strategist Says Start Shorting S&P Now
One month ago, with market pessimism at “dire” all-time highs, the mood on Wall Street was so apocalyptic, and sentiment so capitualitory that when looking at the monthly (July) Fund Manager Survey, even BofA’s uber-bearish Chief Investment Strategist, Michael Hartnett turned bullish correctly timing the face-ripping, short-squeezed, stock-buybacked, retail-invested, CTA-chased meltup. This is how we summarized Hartnett’s findings,
“the strategist writes that ‘H2’22 fundamentals poor but sentiment says stocks/credit rally in coming weeks” and adds that the “contrarian Q3 trade is risk-on if no Lehman, CPI down, Fed pause by Xmas…short cash-long stocks, short US$-long Eurozone, short defensives-long stocks banks & consumer.”
Once again, Hartnett – who over the past year emerged as Wall Street’s most accurate analyst- was spot on, and more importantly, unlike his JPM peers who tell clients to buy every single week oblivious to being called out for total hacks, Hartnett actually timed the pivot just right.
Which brings us to the latest – August – Fund Manager Survey, in which Hartnett polled 284 panelists with $836BN in AUM (full reported available to professional subs), and in which he finds that while sentiment remains uber-bearish – with the BofA Bull & Bear Indicator still at a “max bearish” reading of 0.0 = suggesting no immediate reversal of the bear market rally…
… Hartnett also finds that the mood is “no longer apocalyptically bearish” as hopes rise that inflation & rates shocks end in coming quarters…
… and while the meltup can continue for a little bit longer – at least until Powell flips out about the market blowing his entire plan to tighten financial conditions – Hartnett remains a patient bear, and says he “would fade SPX >4328 as rates up-profits down our base case.” Coming from the guy who just happens to be Wall Street’s most accurate analyst and exactly one month ago correctly predicted “sentiment says stocks/credit rally in coming weeks” we would listen to what he has to say.
As always, the full FMS is full of 28 pages of informative datapoints (if mostly contradictory) available to pro subs, but here we summarize some of the key findings which show why the apocalyptic mood has eased just a bit:
For those seeking contrarian trades to the current euphoria, Hartnett recommends a contrarian bull trade (as services inflation falls, new credit bull begins) = short US$, healthcare & long EU, EM, banks, resources; meanwhile the contrarian bear trade (Wall St & labor market inflation, Fed funds 4-5%, hard recession ’23) = short US stocks, growth stocks (tech), REITs & long staples, utilities.
But while all that may work, the most important take home from Hartnett’s latest FMS is that just as he nailed the meltup one month ago, so his latest reco – to fade the SPX at 4,328 – may prove to be spot on as well because moments ago, eminis rose to a session high of 4,327.5… and reversed.
Is that the start of the next wave lower in risk assets? Check back in one month
Stock Doc
