Over the years I have lost count how many times I have heard the mantra “Excel is just a toy you can’t use it for serious Business Intelligence”. Often from “IT experts” that never had to work with a BI solution from a business user perspective.
In part this statement is true: particularly when Excel is (mis)used as data store for storing copies of similar data in 85 different versions where no one knows what the origin is and if someone has (inadvertently…) changed the logic (formulas) or the actual data. We are all familiar with the resulting spreadsheet hell and related horror stories a plenty:
But is this really Excel’s fault? Not really… It’s just the wrong approach of storing data in the spreadsheet (In rare cases this can make sense for example with Power Pivot as I will point out later) as opposed to using it as a (very flexible and effective!) presentation layer that can cater for most analytical application requirements that involve “power users” in their familiar spreadsheet environment.
Separation of data storage & presentation

The crucial factor is to clearly define the boundaries of how Excel is used. The key to avoid these issues in a business intelligence context is in our opinion the separation of data storage and presentation layer: data should not be pasted directly from a data source (or even worse rekeyed) into a spreadsheet but made interactively accessible from consistent, “single version of the truth” data mart(s) that also include as much as possible key parts of the logic (especially calculations).
Exce(l)ptional New Capabilities
Excel offers great integration with a lot of data sources: out of the box. One of them -fortunately again available in all editions- is Power Pivot (Vertipaq/ xVelocity engine) that enables users to connect to a data source and load millions of records into a model linked to an Excel workbook. This allows the users to build reports as needed based on a consistent single Power Pivot data model that can be automatically updated when the source data changes. In addition to data consistency another crucial aspect is security: as long as security rights are properly defined in the underlying source and the user has to authenticate, she will only ever see what she is allowed to see despite multiple users using the same report definition.
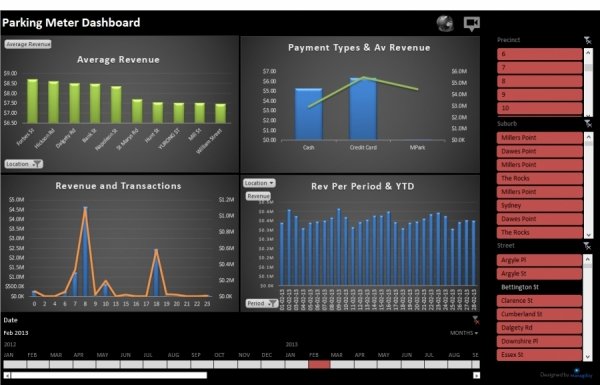
Some examples below (and yes this is all “just” Excel…)

Real Time Finance Data

Professional Dashboards

Flexible Interaction
The Next Level: A Two Way Client Server Solution
Power Pivot is a great solution but it doesn’t cater for every use case particular when there are requirements to:
- use the data model with different clients (e.g. web applications, mobile apps etc.) and multiple users need to work on the same model for different applications.
- write back and collect data into the central model.
In these cases a real client server based solution is needed. This can be for example Analysis Services or other complementary solutions (Managility specializes in Acterys an add-on component to MS SQL Server / Power BI for enabling business user driven modelling write back and planning) that offer a server based two way architecture for reading and writing. In conjunction with Excel Online this approach also enables rolling out professional BI applications to users that only need a web browser.

Professional BI in Excel
Data collection from Pivot Table in server based model (Agility Planning)

Excel Online
Excel based BI application in the web browser
At Managility we have used this architecture approach very successfully for more than 10 years in large scale enterprise BI projects with hundreds of users and Gigabytes of data volumes. The advantages are plentiful:
- consistency and security
- the flexibility that Excel provides in regards to report definition
- Governance & audit trails
- extensive visualisations options and ad hoc analysis is unparalleled
and finally of course:
- Excel knowledge is widely available.
Admittedly, Excel is not the answer in every case (for mobile deployment or interactive dashboards Power BI is a brilliant complementary option) but if properly used in conjunction with a true central data model (these days often cloud based) it can be a key front end option for tremendously powerful business intelligence solutions. Particularly, for analytical application requirements that involve “power users” that are familiar with the spreadsheet environment.
Please don’t hesitate to contact us to arrange a hands on experience of the new options in one of our Fast Start Workshops or the new Advanced Business Intelligence with Excel workshop. All in all, the improvements in Excel/Power BI are definitely a huge leap forward and will pose a substantial threat to currently very popular, read only analysis tools like Tableau and Qlikview whose price tag will be closely analysed by organisations who have already invested in Microsoft licenses.
