


Abstract
mRNA translation plays an evolutionarily conserved role in homeostasis and when dysregulated contributes to various disorders including metabolic and neurological diseases and cancer. Notwithstanding that optimal and universally applicable methods are critical for understanding the complex role of translational control under physiological and pathological conditions, approaches to analyze translatomes are largely underdeveloped. To address this, we developed the anota2seq algorithm which outperforms current methods for statistical identification of changes in translation. Notably, in contrast to available analytical methods, anota2seq also allows specific identification of an underappreciated mode of gene expression regulation whereby translation acts as a buffering mechanism which maintains protein levels despite fluctuations in corresponding mRNA abundance (‘translational buffering’). Thus, the universal anota2seq algorithm allows efficient and hitherto unprecedented interrogation of translatomes which is anticipated to advance knowledge regarding the role of translation in homeostasis and disease.
INTRODUCTION
Regulation of gene expression is a multi-step process including transcription, mRNA-processing, -transport, -stability, -translation and protein stability (1). Although the precise relative contribution of each of these processes to corresponding protein levels remains controversial (2) and context dependent (3,4), several studies have implicated mRNA translation as a key mechanism which determines the composition of the proteome (5,6). Notably, rapid adaptation to changes in the cellular environment requires precipitous adjustment of the proteome which is, in addition to protein degradation, largely accommodated by altering the efficiency of mRNA translation (7). Direct transcriptome-wide quantification of translational efficiency is therefore required to enhance the understanding of how protein levels are regulated in response to a variety of stimuli and stressors, and in normal vs. diseased cells. Under most conditions, the number of ribosomes associated with an mRNA is proportional to its translational efficiency (8). Transcriptome-wide measurement of translational efficiency is therefore commonly determined using polysome- or ribosome-profiling techniques. For polysome-profiling (9), the pool of efficiently translated mRNA (commonly mRNA with >3 bound ribosomes) is isolated, whereas in ribosome profiling (10) ribosome protected fragments (RPFs) are generated. Both polysome- and ribosome-profiling also involve isolation of total mRNA. Expression levels of polysome-associated mRNA or RPFs and total mRNA are then quantified using RNA sequencing (RNAseq) (10,11). Advantages and limitations of these methods have been extensively reviewed elsewhere (12–16).
A paramount challenge during identification of changes in translational efficiencies is that amounts of polysome-associated mRNA and RPFs can also be influenced by steps in the gene expression pathway which modulate total mRNA levels (e.g. transcription and/or mRNA stability; Figure 1A). Analysis of bona fide changes in translational efficiency therefore requires identification of changes in amounts of polysome-associated mRNA or RPFs that are independent of changes in corresponding total mRNA levels. To this end, the analysis of translational activity (anota) algorithm (17) applies per-gene analysis of partial variance (APV) (18) coupled with variance shrinkage (19). This approach is superior to methods comparing differences in log-ratios (i.e. between polysome-associated mRNA or RPFs and total mRNA, commonly referred to as translational efficiency [TE] scores) across experimental conditions, inasmuch as log-ratio based approaches do not efficiently adjust changes in polysome-associated mRNA or RPFs for changes in total mRNA levels due to spurious correlations (20). Spurious correlations were initially described by Pearson in 1896 (21) and imply that the log-ratio of polysome-associated mRNA or RPFs to total mRNA levels, can systematically correlate with total mRNA levels. This can lead to false positive identification of alterations in translational efficacy and consequent misinterpretations of biological phenomena. Such spurious correlations are abundant in both polysome- and ribosome-profiling studies suggesting that log-ratio based approaches should be avoided (20).
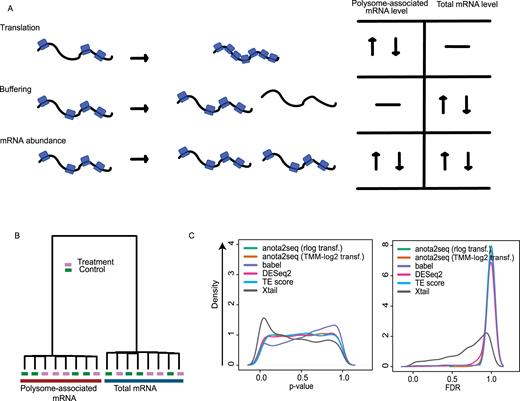
Analysis of differential translation using Xtail or babel is associated with increased false positive findings. (A) Gene expression may be modulated via changes in translational efficiency leading to altered protein levels (top panel); buffering wherein the ribosome occupancy of the mRNA remains unaltered despite changes in corresponding mRNA level (middle panel); and congruent changes in mRNA abundance and its ribosome occupancy. (B) Hierarchical clustering of a simulated dataset with a control and treatment condition including polysome-associated mRNA and total mRNA samples where no mRNAs are regulated (i.e. a NULL model; data provided in Supplementary file 2). (C) P-value and FDR density plots for analysis of differential translation comparing treatment to control for each method using the data from (B).
A recent study evaluated anota for analysis of RNAseq data and concluded its poor performance for identification of differential translation (22). Anota, however, was developed for normalized data on a continuous logarithmic scale. In the study in question, anota was inappropriately applied on non-normalized and non-transformed count data originating from RNAseq studies. Several methods specifically developed for analysis of RNAseq data are available within the commonly used statistical programming language ‘R’, including babel (23) and Xtail (22). Moreover, DESeq2 (24) which was developed for analysis of differential gene expression using RNAseq data has also been employed for analysis of differential translation (25). However, all these methods use log-ratios (or equivalent analysis) and therefore may suffer from spurious correlations. This highlights a need to develop an algorithm for analysis of changes in translation efficiencies applicable to RNAseq data which, similarly to anota, is not affected by spurious correlations.
Traditionally, changes in translational efficiencies are thought to modulate levels of encoded proteins under conditions wherein corresponding mRNA levels are not altered in a similar fashion (Figure 1A). Emerging data, however, point to an additional mode for regulation of translation, whereby translational mechanisms are employed to maintain protein levels via feedback loops compensating for changes in corresponding mRNA levels. For example, levels of polyamines are tightly regulated via a negative feedback loop involving antizyme (OAZ) that induces degradation of ornithine decarboxylase (ODC), a rate-limiting enzyme for polyamine synthesis (26). An increase in polyamine levels leads to a +1 ribosome frameshift during translation of the OAZ mRNA which is required to synthesize the active OAZ protein (26,27). Thus, it is expected that altered levels of the OAZ mRNA will be compensated by translational mechanisms, which sense polyamine levels. Similarly, the level of the AMD1 protein, whose synthesis is modulated by polyamines via a mechanism involving an upstream open reading frame (28), is not expected to be affected by the amount of mRNA but rather the level of polyamines. These examples highlight that regulation of translation can act as a buffering mechanism which gatekeeps the proteome to maintain homeostasis. Larger scale studies also support that mRNA translation can act as a buffering mechanism to preserve protein levels despite fluctuations in mRNA levels. In bacteria, translation equilibrates protein complex stoichiometry (29) and protein levels of conserved pathways across species (30) despite differences in mRNA levels. Similarly, in humans, co-expression of mRNAs transcribed from spatially proximal genomic locations is lost via post-transcriptional mechanisms such that protein co-expression is instead observed for functionally related proteins whose encoding mRNAs are transcribed from different genomic regions (31). Furthermore, translational buffering was also reported to compensate for inter-individual, inter-species and inter-tissue differences in mRNA levels (32–35). Although the scopes and the biological contexts of translational buffering mechanisms are still being established, these examples indicate an urgent need for algorithms enabling efficient separation of changes in translation affecting protein levels from those maintaining proteome homeostasis.
Herein, we describe the universal anota2seq algorithm for analysis of changes in translational efficiencies using either continuous (e.g. DNA-microarray) or count (i.e. RNAseq) data as input. Furthermore, anota2seq is not affected by spurious correlations, outperforms other methods and is the only algorithm to date which allows statistics-based separate identification of changes in translational efficiencies affecting protein levels and buffering.
MATERIALS AND METHODS
Retrieval and processing of polysome-profiling data
Already processed RNAseq count data were obtained from published studies (11,36,37) available at the Gene Expression Omnibus (GEO) (38) with accession numbers GSE99909, GSE90070 and GSE35469. From these data sets, specific conditions were selected and used in our analysis. From Liang et al. (11), we used all total mRNA and optimized sucrose gradient polysome-associated mRNA samples; from Guan et al. (36), we selected the control, thapsigargin 1 h and thapsigargin 16 h samples; and from Hsieh et al. (37), we selected data from the DMSO and rapamycin conditions. Genes that could not be resolved (i.e. based on sequence similarity), were duplicated in the count table or had 0 counts in at least one sample were removed. Data from all studies were normalized using the TMM-log2 (39) approach [used in Figure 5C and D and Supplementary Figure S4B top right, bottom right]). Additionally, data from Guan et al. (36) were also processed and used to simulate RNAseq data as described below. DNA- microarray polysome-profiling data from Parent et al. (40) were retrieved from ArrayExpress (41) with accession number E-MEXP-958. The data were normalized using the rma() function (default settings) of the oligo package (42) (data were used in Supplementary Figure S4B).
Retrieval and processing of ribosome-profiling data
Raw sequencing files from a recent study (43) were obtained from GEO (GSE89183). Only samples of the shLuc (control), shRPL5 and shRPS19 conditions were used. Reads from RPFs were trimmed for adapter sequence ‘AGATCGGAAGAGCACACGTCTG’ and reads shorter than 26 or longer than 32 bases were discarded. RNAseq reads originating from total mRNA and RPF sequencing libraries were then aligned to hg38 (gencode release 29 GRCh38.p12) using bowtie (settings –best –strata –m 1 –l 25 –a). Uniquely aligned and unmapped reads were then aligned to the full transcript or the protein coding region (the latter only for RPF reads) of protein coding mRNAs defined by RefSeq (44) using bowtie (settings –best –strata –m 1 –norc –l 25 –a). When there were multiple RefSeq mRNAs for the same gene, the one with the largest number of mapped reads across all samples was used for downstream analysis.
RNAseq data simulation
Method performance comparisons were done using simulated data. In order to obtain simulated data with realistic characteristics of polysome profiling data quantified by RNAseq, we first estimated means and dispersions from an empirical data set and sampled from negative binomial distributions (NB) using these parameters. We used the empirical RNAseq data produced in Guan et al. (using the thapsigargin 16 h treatment condition) (36) and the simulation methods described in (45) with several modifications as described below. We simulated 4 replicates of 2 conditions referred to as ‘control’ and ‘treatment’. In addition to a set of unchanged mRNAs between the two conditions, three sets of regulated mRNAs were simulated to reflect: changes in translational efficiency affecting protein levels (i.e. a change in polysome-associated mRNA independent of a change in total mRNA; Figure 1A; referred to as ‘translation set’ below); translational buffering (a change in total mRNA that is not reflected by a similar change in polysome-associated mRNA; Figure 1A; referred to as ‘buffering set’ below); and mRNA abundance (i.e. a congruent change in polysome-associated and total mRNA; Figure 1A; referred to as ‘mRNA abundance set’ below). Each set is represented by 5% of all mRNAs (total number of simulated mRNAs was 9856).
For unchanged mRNAs (i.e. not belonging to any of the regulated sets), the treatment condition was sampled from a distribution with |${\hat{\mu }_{gi}}$| and |${\hat{\phi }_{gi}}$| identical to the control condition for that gene. For sets of regulated mRNAs, these estimates were used as base parameters and then modified as follows:
For transcripts belonging to the translation set (Figure 1A; 493 mRNAs, similar number of up- and down-regulation), the base parameters were used to simulate total mRNA for both conditions and polysome-associated mRNA for the control condition. The mean and dispersion parameters used to simulate polysome-associated mRNA under the treatment condition were modified as follows: an effect parameter |${\alpha _g}$| for upregulation was sampled from a vector containing values from 1.5 to 3 with steps of 0.2. For down regulation the effect parameter was modified to 1/|${\alpha _g}$|. The modified mean parameter was then |${\alpha _g}{\hat{\mu }_{gi}}$| (or 1/|${\alpha _g}{\hat{\mu }_{gi}}$| for down regulation). In order to keep the mean-variance relationship as similar as possible to the empirical data, the modified dispersion was taken as the dispersion of the transcript from the empirical data having the closest mean estimate to |${\alpha _g}{\hat{\mu }_{gi}}$| (or 1/|${\alpha _g}{\hat{\mu }_{gi}}$| for down regulation). Similarly, for transcripts belonging to the buffering set (Figure 1A; 493 mRNAs), base parameters were used for polysome-associated mRNA (both conditions) and total mRNA (control condition). The effect parameter was introduced during simulation of total mRNA under the treatment condition and applied as described above for the translation set. For transcripts in the mRNA abundance set, base parameters were used for total and polysome-associated mRNA under the control condition. The same effect parameter was then introduced to modify the base parameters of the distribution from which total and polysome-associated mRNA were sampled under the treatment condition; and applied as described above for translation. Transcripts with a simulated count of zero in any sample were removed before analysis. To assess the reproducibility of the simulation, five such data sets were simulated. Means as well as standard deviations over the five data sets are provided for different metrics (e.g. number of identified mRNAs and area under the curve (AUC) for receiver operating characteristics (ROC) curves, see figure legends for more details). An example sampled data set is supplied as Supplementary File S1.
To assess the ability of methods to control for type I error/false discovery rate in the absence of any true regulation between control and treatment, we also simulated a NULL data set using base parameters for all mRNAs in both conditions (i.e. all mRNAs are unchanged; the NULL data set is supplied as Supplementary File S2). Moreover, we simulated data sets without mRNAs in the buffered set (i.e. only containing simulated mRNAs of the unchanged, mRNA abundance and translation sets); data sets with increased variance (where a percentage of each count [5%, 10%, 15%] is added or subtracted [same probability to add or subtract]); and data sets with increasing total number of RNAseq reads (2.5, 5, 10 and 15 million RNAseq reads per sample). The latter was achieved by obtaining |${\hat{\mu }_{gi}}$| and |${\hat{\phi }_{gi}}$| parameters using empirical data on which the total number of counts has been reduced (e.g. for 2.5 million reads for each RNA source, condition and replicate, we sampled 2.5 million reads from the total available amount of reads mapped to mRNAs). The |${\hat{\mu }_{gi}}$| and |${\hat{\phi }_{gi}}$| parameters of the empirical data with reduced total counts were then used as input for the NB distribution to simulate data sets with reduced sequencing depths using the approach described above. To assess the impact of varying sequencing depths across samples, |${\hat{\mu }_{gi}}$| and |${\hat{\phi }_{gi}}$| parameters obtained from empirical data with 15 or 5 million reads were used and 25%, 50% or 75% of the samples were substituted with samples generated with |${\hat{\mu }_{gi}}$| and |${\hat{\phi }_{gi}}$| parameters estimated from empirical data with a sequencing depth of 2.5 million reads.
Comparison of methods for analysis of differential translation using simulated data
We compared anota2seq (version 1.2.0 deposited at Bioconductor) to tools available in the statistical programming language ‘R’ for analysis of the translatome: babel (23) (version 0.3.0), DESeq2 (24) (version 1.20.0), Xtail (22) (version 1.1.5) and translational efficiency score (TE-score, calculated using a custom function). All analyses were performed using R (version 3.5.0). Identical simulated count data were used as input for babel, DESeq2 and Xtail. For TE-score analysis, counts were normalized using DESeq2 (normalization for library size using the median ratio method) and log2 transformed. In anota2seq, counts are either rlog (24) or TMM-log2 (39) normalized/transformed. Similar to anota (17), anota2seq combines APV (18) and the Random Variance Model (RVM) (19) and uses a two-step process that firstly assesses the model assumptions for (i) absence of highly influential data points, (ii) common slopes of sample classes, (iii) homoscedasticity of residuals and (iv) normal distribution of per gene residuals. Anota2seq then performs analysis of changes in translational efficiency affecting protein levels or buffering using APV and RVM. Babel and Xtail were applied using default parameters. DESeq2 (24) was applied as previously described (25). TE-scores were calculated as the difference between conditions in log2-ratios (between polysome-associated and total mRNA). Statistics for changes in TE were calculated using Student's t-test (P-values were adjusted using the Benjamin–Hochberg approach) (47). When applying default settings, RiboDiff (48) essentially provides a python implementation of the DESeq2 approach applied herein. For all methods, ROC and AUC analyses were performed on reported P-values prior to any filtering (for anota2seq, this is the output called ‘full’ from the anota2seqGetOutput function). When reporting numbers of identified mRNAs at false discovery rate (FDR) thresholds, default filtering was applied (after fitting all gene-level APV models, anota2seq allows the user to filter the results to exclude unrealistic APV models to reduce the number of false positives; this is the default output called ‘selected’ from the anota2seqGetOutput function). The outputs from all methods for the NULL data set and the data set containing translation, buffering and mRNA abundance sets of mRNAs are provided as Supplementary Files S1–2.
Re-analysis of the simulated data set from Xiao et al.
The simulated data set from Xiao et al. (22) was retrieved from the published supplementary files. Simulated true positive events by the authors (Supplementary Figure S4B; top left) were reclassified into translation, mRNA abundance and buffering sets based on fold change thresholds (Supplementary Figure S4C). We then applied anota2seq, babel, DESeq2, TE-score and Xtail on the simulated data set and evaluated algorithm performance using the reclassified unchanged, mRNA abundance, buffering and translation sets (Supplementary Figure S4C).
Analysis of the empirical data sets using anota2seq
RNAseq data from Liang et al. (11) and Guan et al. (36) were analyzed for changes translational efficiencies affecting protein levels using the anota2seq algorithm. To assess the impact of batch effect adjustment, the analysis of data from Liang et al. was performed with and without including the replicate as a covariate in the models (using the ‘batchVec’ parameter in anota2seq). No batch effect adjustment was performed on data from Guan et al. (36). To assess the need for replication, subsets of two or three replicates were re-analyzed (all possible combinations of two or three samples were used and averages of mRNAs passing thresholds were calculated). Of note, anota2seq analysis can be performed on two replicates per condition if at least three conditions are included in the models. Thus, models from Guan et al. data were fitted on data from three conditions (control, Thapsigargin 1 h, Thapsigargin 16 h) and only the ‘Thapsigargin 16 h versus control’ contrast was considered. A similar approach was used for ribosome profiling data from Khajuria et al. (43) where three conditions (shRPS19, shRPL5 and shLUC) with two replicates each were used as input for anota2seq analysis with adjustment for replicate number (i.e. via the ‘batchVec’ parameter). Raw read counts were normalized using the ‘normalize’ parameter in the anota2seqDatasetFromMatrix() function set to ‘TMM-log2’. We focused on the contrast comparing shRPS19 to shLuc. Transcripts were considered significantly changing their translational efficiency leading to altered protein levels or translational buffering when passing default filtering criteria in anota2seq (except for the FDR which was set to <0.10 using the ‘maxPAdj’ parameter of the anota2seqRun function).
R-packages and settings
Hierarchical clustering and principal components analysis (PCA) plots were generated using the hclust() and prcomp() R-functions, respectively (all using default settings). Receiver operating characteristics (ROC) curves, area under the curve (AUC), partial AUC (pAUC) and precision recall curves were generated using the ROCR R-package (version 1.0-7) (49). P-values from each method were used for ROC analysis. pAUC were obtained at 5% and 15% false positive rate (fpr) by using the ‘fpr.stop’ parameter in the ROCR package; the acquired AUC was divided by the corresponding fpr cut-off rate. The precision is the positive predictive value and the recall is the true positive rate or sensitivity.
Statistics
All statistical tests within the anota2seq package are two-tailed.
RESULTS
Babel and Xtail algorithms underperform under a NULL model
By monitoring quality control steps (see materials and methods), we first identified suitable data normalization/transformation for application of anota2seq to RNAseq data (rlog (24) and TMM-log2 (39)). We then compared the performance of anota2seq, using rlog or TMM-log2 transformed data, to babel (23), DESeq2 (24), TE-score and Xtail (22). An essential aspect during identification of differences in gene expression is control of type I error/FDR under a NULL model (i.e. when there are no true differences in gene expression). Importantly, the performance of the method on a data set without true gene expression changes is unrelated to its sensitivity; and the distribution of obtained P-values is expected to be uniform resulting in FDRs equal to 1 (50). We assessed this using simulated data sets with control and treatment conditions sampled from the same distribution (i.e. where there were no differences in expression between conditions). The simulated data set closely mirrored characteristics of the empirical data set from which simulation parameters were obtained (Supplementary Figure S1A). Consistent with observations from empirical data sets (36), simulated data for total mRNA or polysome-associated mRNA were different when assessed using hierarchical clustering (Figure 1B). As expected, for a data set under a NULL model, there was no further separation between the treatment and control groups (Figure 1B). The resulting density plots of p-values for changes in translational efficiency (Figure 1C) revealed uniform distributions for all methods except Xtail, which exhibited an overrepresentation of low p-values, and babel, which showed an overrepresentation of high p-values and a local enrichment of low p-values (Figure 1C). Accordingly, Xtail and babel identified mRNAs as differentially translated even when applied to a NULL data set, which was a priori simulated not to exhibit any changes in translation (Figure 1C; at an FDR <0.05 Xtail and babel reported 276 and 66 transcripts, respectively, as changing their translation). Moreover, although the distribution of P-values appears approximately uniform, DESeq2 also identified mRNAs as differentially translated when applied to the NULL data set (Figure 1C; at an FDR < 0.05 DEseq2 reported 15 such transcripts). None of the other methods reported any transcripts from the NULL data set as differentially translated (FDR < 0.05). Furthermore, Xtail can analyze data sets with only one replicate per condition and we therefore assessed whether the number of replicates affected the amount of false positives reported by Xtail. Importantly, there was a strong increase in false positives reported by Xtail when applied to NULL data sets with only one replicate (Supplementary Figure S1B). Xtail and babel therefore have limited usability for statistical FDR-based analysis as they indicate changes in translational efficiency even when such changes are absent.
Anota2seq outperforms current methods by allowing distinction between changes in translational efficiency affecting protein levels and translational buffering
Algorithms for analysis of changes in translational efficiency necessitate adjustment for concomitant changes in mRNA levels and separation between changes in translational efficiency leading to altered protein levels and buffering (Figure 1A). We therefore simulated data sets with two conditions including sets of transcripts regulated by changes in mRNA abundance, translation or buffering (8377 unchanged mRNAs and 493 mRNAs per regulated set; Figures 1A and 2A). The resulting data sets closely mirrored characteristics of the empirical data set used to obtain simulation parameters (Supplementary Figure S1A). Furthermore, as expected, hierarchical clustering showed separation of conditions both for total mRNA and polysome-associated mRNA samples; and therefore captures the complex structure of polysome-profiling data, which is similar to ribosome-profiling data ((43); Figure 2B). We next determined the performance of each method for detection of changes in translational efficiency leading to altered protein levels. Accordingly, identification of mRNAs from the translation set were considered as true positive events whereas identification of mRNAs from unchanged, buffered and mRNA abundance sets were considered false positives (Figure 2A). The algorithms were applied using default settings on 5 data sets simulated as in Figure 2A. The resulting outputs prior to any filtering (see material and methods) were then evaluated. ROCs showed that anota2seq analysis using rlog or TMM-log2 data performs similarly and outperforms all other methods as judged by AUC and pAUCs (Figure 2C, Table 1). In addition, precision recall curves reveal higher initial precision values for anota2seq compared to other methods (Figure 2C). This can be explained by the analysis principle of the other methods. TE-score, babel, DESeq2 or Xtail cannot separate changes in translational efficiency which affect protein levels from buffering. The latter is consistent with the reported superior performance of anota as compared to TE-score in reflecting changes in the proteome (51).
![Anota2seq outperforms other methods for analysis of changes in translational efficiency affecting protein levels. (A) Scatterplot of polysome-associated and total mRNA log2 fold changes between treatment and control groups for a simulated dataset (provided in Supplementary file 1). Transcripts simulated as unchanged or belonging to mRNA abundance, translation or buffering sets are indicated. (B) Hierarchical clustering of gene expression data from (A). (C) Receiver operating characteristics curves for analysis of differential translation in a simulated dataset (i.e. from A-B; top). Precision recall curves for analysis of differential translation in the simulated dataset (bottom). For both analyses, identification of a transcript from the translation set was considered a true positive event. Vertical lines indicate 5% and 15% false positive rates. (D) Numbers of mRNAs identified as differentially translated belonging to translation (true positives [TP]), buffering (false positives [FP]), mRNA abundance (FP) or unchanged (FP) sets are indicated for each method at several FDR thresholds (mean and standard deviations from 5 simulated data sets are indicated). Red lines indicate the total amount of mRNAs simulated from each set of regulated transcripts. (E) Shown are differences in the number of mRNAs showing differential translation belonging to the four sets in (D) when changing the FDR threshold from 5% to 15% (mean from 5 simulated data sets).](https://oup.silverchair-cdn.com/oup/backfile/Content_public/Journal/nar/47/12/10.1093_nar_gkz223/1/m_gkz223fig2.jpeg?Expires=1716405263&Signature=a4MZxaVe4RBYCqeCL0ELlJ9k6T6b98uTEpOXANv0r7SuUamGTrqjT~lOTNHJUaS28htU8EcgDZ8lJWay0M9PEBuDkFa0OIPANDiilcUsvGNN-FoZDstmLVLp3ReXBlF6azFzJbwff14dLpGDFfoJN0tjkiCwChSzClwAaV~g9sNmjKRih1FJEqj043S7ieUfJPuZ4MZkacWys5fysHRaokv3cc9ECeL-9FoJ7W4KXEgdqrVU9shfzufG~qVLBgQ05OZ0kPNb8W36gjZgm856Hy5unzUyTIoNPg3UT0fOvvfQHN58JuYtgKqU2kkrUiR3M3QNc74-qz4BxV28jp1iMg__&Key-Pair-Id=APKAIE5G5CRDK6RD3PGA)
Anota2seq outperforms other methods for analysis of changes in translational efficiency affecting protein levels. (A) Scatterplot of polysome-associated and total mRNA log2 fold changes between treatment and control groups for a simulated dataset (provided in Supplementary file 1). Transcripts simulated as unchanged or belonging to mRNA abundance, translation or buffering sets are indicated. (B) Hierarchical clustering of gene expression data from (A). (C) Receiver operating characteristics curves for analysis of differential translation in a simulated dataset (i.e. from A-B; top). Precision recall curves for analysis of differential translation in the simulated dataset (bottom). For both analyses, identification of a transcript from the translation set was considered a true positive event. Vertical lines indicate 5% and 15% false positive rates. (D) Numbers of mRNAs identified as differentially translated belonging to translation (true positives [TP]), buffering (false positives [FP]), mRNA abundance (FP) or unchanged (FP) sets are indicated for each method at several FDR thresholds (mean and standard deviations from 5 simulated data sets are indicated). Red lines indicate the total amount of mRNAs simulated from each set of regulated transcripts. (E) Shown are differences in the number of mRNAs showing differential translation belonging to the four sets in (D) when changing the FDR threshold from 5% to 15% (mean from 5 simulated data sets).
Mean and standard deviation (sd) of pAUCs and AUCs for an ROC analysis assessing performance for identification of changes in translational efficiency affecting protein levels in simulated data sets (n = 5) including translation, buffering, mRNA abundance and unchanged sets of transcripts (Figure 2A)
| AUC | pAUC 5% | pAUC 15% | ||||
|---|---|---|---|---|---|---|
| Method | Mean | sd | Mean | sd | Mean | sd |
| anota2seq (rlog transf.) | 0.969 | 0.005 | 0.719 | 0.023 | 0.858 | 0.017 |
| anota2seq (TMM-log2 transf.) | 0.966 | 0.009 | 0.702 | 0.043 | 0.847 | 0.031 |
| babel | 0.936 | 0.002 | 0.376 | 0.017 | 0.671 | 0.009 |
| DESeq2 | 0.939 | 0.002 | 0.431 | 0.013 | 0.715 | 0.008 |
| TE score | 0.923 | 0.004 | 0.385 | 0.016 | 0.655 | 0.009 |
| Xtail | 0.937 | 0.002 | 0.414 | 0.015 | 0.704 | 0.009 |
To further characterize the performance of the methods at commonly employed FDR thresholds, we determined the number of identified mRNAs from translation, buffering, mRNA abundance and unchanged sets at a 5%, 10% or 15% FDR threshold (Figure 2D; using the default settings of each method). Babel and TE-score identified fewer true positive events (i.e. transcripts from the translation set) than the other methods. Anota2seq identified approximately the same number of true positives at the 15% FDR threshold as DESeq2 while Xtail identified slightly more true positives. The number of mRNAs identified from the buffered set (here considered false positives as they do not lead to changes in protein levels) by each method reveals that only anota2seq can efficiently distinguish these from transcripts whose change in translational efficiency leads to altered protein levels (Figure 2D). Notwithstanding that all methods perform similarly in terms of rejecting mRNAs changing their abundance, there were dramatic differences in terms of identification of unchanged mRNAs. Anota2seq, babel and TE-score identified few unchanged mRNAs as being perturbed, while Xtail and DEseq2 identified a sizeable number of unchanged mRNAs as being altered (Figure 2D). Strikingly, Xtail identified >800 such mRNAs at FDR <15%, which is consistent with the poor performance of Xtail under the NULL model (Figure 1C). To contrast 5% and 15% FDR thresholds, we calculated the difference in number of identified mRNAs from each set of transcripts (Figure 2E). For anota2seq, there was a gain in true positives at the cost of an approximately equal increase in false positives, whereas for other methods, especially Xtail, increasing the FDR threshold introduced dramatically more false positives. Notably, the output from RiboDiff under default settings (48) is essentially a python implementation of the DESeq2 approach and, as expected, the performance was almost identical to that of DESeq2 (Supplementary Figure S2). Below, we therefore only report results of DESeq2 as representative for both methods. In conclusion, anota2seq outperforms current methods by discriminating between changes in translational efficiency altering protein levels versus buffering; and by identifying fewer false positives at commonly employed FDR-based thresholds.
Anota2seq outperforms current methods for statistical analysis of translational efficiency even in the absence of translational buffering
We next compared algorithms using a simulated data set including the translation and mRNA abundance sets (493 mRNAs each; Figure 1A) together with a set of unchanged transcripts (8870 mRNAs), but without the buffered set of mRNAs (Supplementary Figure S3A and B). As expected from their inability to separate transcripts from translation and buffering sets (Figure 2D), under these conditions babel, DESeq2, TE-score and Xtail showed improved performance as judged by pAUC and AUC, which was comparable to anota2seq (Supplementary Table S1). Moreover, excluding the set of buffered transcripts resulted in an increase in the precision (compare Supplementary Figure S3C to Figure 2C). Accordingly, the performance of statistical analysis under different FDR thresholds paralleled the analysis which included the buffering set of transcripts (compare Supplementary Figure S3D and E to Figure 2D and E). This comprised comparable performance of anota2seq and DEseq2 (24) for identification transcripts from the translation set (Figure 1A); and increased identification of mRNAs from the unchanged set for DESeq2 and Xtail (i.e. false positives) as compared to anota2seq. Analogous to the simulation including the buffered set, TE-score identified fewer changes in translational efficiency but did not assign unchanged mRNAs low FDRs. These results demonstrate that anota2seq outperforms other methods for FDR-based analysis of changes in translational efficiency even in the absence of buffering (Supplementary Figure S3D). Therefore, anota2seq can be applied to efficiently identify changes in translational efficiency, independent of underlying modes of regulation.
These results appear to contradict a recent report which suggested good ROC and precision/recall performance for babel, TE-score and Xtail and poor performance for anota (22). While the reported poor performance of anota (17) was caused by inappropriate application of anota on non-normalized and non-transformed counts, the difference in precision recall performance for babel, TE-score and Xtail was unclear. We therefore examined the simulated data set used during development of Xtail (Supplementary Figure S4A). This revealed that mRNAs selected as true positives for changing their translational efficiency appeared not to distinguish between levels of regulation (translation, buffering or mRNA abundance [Figure 1A]) and also included mRNAs with seemingly unchanged expression (Supplementary Figure S4B top left). Moreover, there were mRNAs which showed increased polysome-association but strongly decreased mRNA levels, which represent unlikely biological events that were not observed in any of the empirical data sets examined (11,36,37,40,43) (Supplementary Figure S4B top right and lower panels). However, if such regulation would exist we speculate it to result in altered protein levels. We reclassified mRNAs in this simulated data set (Supplementary Figure S4C) and examined the population of mRNAs that were identified at different FDR thresholds. These findings closely mirrored results from herein simulated data sets, except for babel, which identified very few regulated events (Supplementary Figure S4D and E).
Analysis of translational buffering using anota2seq
As discussed above, translational buffering holds potentially important biological information but algorithms using statistics to selectively capture buffering have not yet been developed. We therefore implemented analysis of translational buffering in the anota2seq software. This implementation is based on the same principle as anota2seq analysis that captures changes in translational efficiency affecting protein levels (i.e. APV coupled with variance shrinkage) except that it captures changes in total mRNA levels that are buffered by translation (i.e. alterations in total mRNA that are not paralleled by changes in levels of polysome-associated mRNA or RPFs). To assess the performance of anota2seq for analysis of buffering, we used the same data set as in Figure 2A and B (i.e. with transcripts from translation, buffering, mRNA abundance and unchanged sets; Figure 1A). In contrast to the analysis in Figure 2A and B, identification of translationally buffered mRNAs was considered as true positive events, whereas identification of unchanged mRNAs or mRNAs belonging to translation and mRNA abundance groups were considered false positive events. Importantly, pAUC and AUC for translational buffering analysis were comparable to the performance of anota2seq for analysis of changes in translational efficiency (Figure 3A and Table 2), while very few mRNAs from the translation set were identified during analysis of translational buffering (Figure 3B). Moreover, a relaxed FDR threshold primarily led to additional identification of mRNAs from the buffered set (Figure 3C). Thus, anota2seq can be efficiently applied for FDR-based identification of translationally buffered mRNAs.
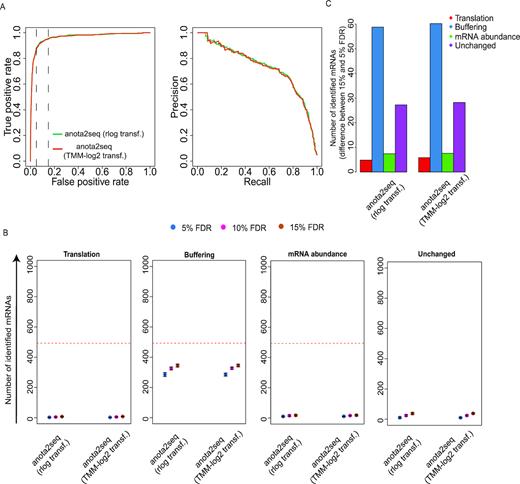
Efficient identification of translational buffering using anota2seq. (A) Receiver operating characteristics curves (left) and precision recall curves (right) for analysis of translational buffering using anota2seq. The data set is the same as in Figure 2A and B but identification of mRNAs from the buffering set were considered true positive events. Vertical lines indicate 5% and 15% false positive rates. (B) Numbers of mRNAs identified as buffered belonged to the translation (FP), buffering (TP), mRNA abundance (FP) or unchanged (FP) sets are indicated at several FDR thresholds (mean and standard deviations from 5 simulated data sets are indicated). Red lines indicate the total amount of mRNAs simulated for each set of regulated transcripts. (C) Shown are differences in the number of mRNAs identified as buffered belonging to the four sets in (B) when changing the FDR threshold from 5% to 15% (mean from five simulated data sets).
Mean and standard deviation (sd) of AUCs and pAUCs for an ROC analysis assessing performance for identification of changes in translational efficiency leading to buffering in simulated data sets (n = 5) including translation, buffering, mRNA abundance and unchanged sets of transcripts (Figure 2A)
| AUC | pAUC 5% | pAUC 15% | ||||
|---|---|---|---|---|---|---|
| Method | Mean | sd | Mean | sd | Mean | sd |
| anota2seq (rlog transf.) | 0.965 | 0.004 | 0.703 | 0.016 | 0.848 | 0.016 |
| anota2seq (TMM-log2 transf.) | 0.966 | 0.004 | 0.706 | 0.016 | 0.849 | 0.012 |
| AUC | pAUC 5% | pAUC 15% | ||||
|---|---|---|---|---|---|---|
| Method | Mean | sd | Mean | sd | Mean | sd |
| anota2seq (rlog transf.) | 0.965 | 0.004 | 0.703 | 0.016 | 0.848 | 0.016 |
| anota2seq (TMM-log2 transf.) | 0.966 | 0.004 | 0.706 | 0.016 | 0.849 | 0.012 |
Assessing robustness of algorithms for translatome analyses
Experimental and technical challenges and/or study designs may give rise to data sets exhibiting dramatically different characteristics (52,53). This includes different levels of variance and sequencing depth and we therefore assessed the influence of such factors on the performance of the algorithms. Increased variance (Figure 4A) led to a moderate decrease in the number of true positives identified at an FDR threshold of 15% for all methods except TE-score-based analysis, which was particularly affected (Figure 4B and C). This was associated with a decrease in performance as assessed by ROC and precision recall curves (Supplementary Figure S5A–F). As evidenced by pAUC and AUC, anota2seq outperforms other methods at all variance levels in analysis of changes in translational efficiency affecting protein levels using simulated data sets including all sets of regulated transcripts (i.e. translation, buffering and mRNA abundance [Figure 1A]; Supplementary Figure S5; Supplementary Table S2). Reduced sequencing depth had no clear effect on ROC analysis within algorithms until 5 million reads (Supplementary Figure S6; Supplementary Table S3) but at 2.5 million reads all algorithms underperformed (Figure 5A and B). Therefore, while all algorithms except TE-based analysis perform well under increased variance, they all require ∼5 million reads mapped to protein coding mRNAs for efficient analysis. Next, we assessed the impact of varying sequencing depth across samples by analyzing data sets with increasing proportions of samples with a low sequencing depth (2.5M reads) (Supplementary Figure S7A) and monitoring the performance of included algorithms for statistical identification of changes in translational efficiencies affecting protein levels (Supplementary Figure S7B). Although TE-score based analysis was most affected, the performance of all methods decreased as the proportion of samples with low sequencing depth increased (Supplementary Figure S7B; Supplementary Figure S8). Notably, for all methods except TE-score based analysis, the performance with a moderate proportion of samples with low sequencing depth (25%) is comparable to the data set with uniformly high sequencing depth (15M reads in Supplementary Figure S7). When reducing the sequencing depth in the analysis from 15M to 5M reads and adding increasing proportions of samples with a low sequencing depth (2.5M reads; Supplementary Figure S9A), similar patterns, albeit less pronounced, were observed (Supplementary Figure S9B). Finally, when samples with low sequencing depth were unevenly distributed such that all samples under a condition suffer from this limitation, an increase in identification of false positives (unchanged mRNAs) was observed for all methods except babel and TE-score (Supplementary Figure S10). Hence, all algorithms except TE score perform relatively well when the proportion of samples with low sequencing depth (i.e. 2.5M reads mapped to protein coding mRNA) is 25% or less.
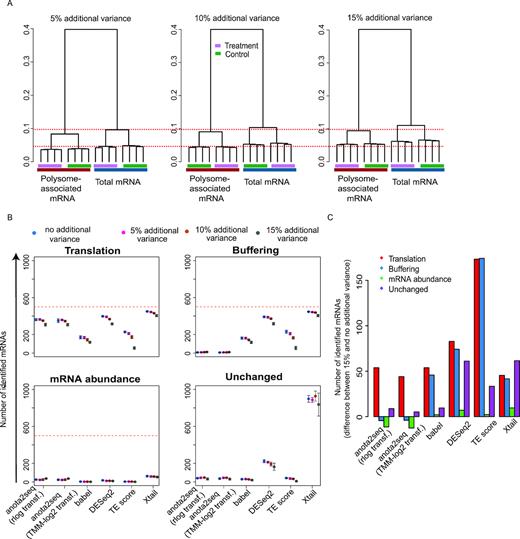
Evaluation of sensitivity to increased variance during analysis of changes in translational efficiency affecting protein levels. (A) Hierarchical clustering of simulated data sets harboring transcripts from unchanged, translation, buffering and mRNA abundance sets (Figure 1A). Data sets were simulated with increasing variance. Red dotted lines provide references across simulated data sets. (B) Numbers of mRNAs identified as differentially translated from translation (TP), buffering (FP), mRNA abundance (FP) or unchanged (FP) sets of transcripts are indicated for each method at a 15% FDR threshold (mean and standard deviations from 5 simulated data sets are indicated). Red lines indicate the total amount of mRNAs simulated for each set of regulated transcripts. (C) Difference in the number of mRNAs identified as differentially translated (FDR < 0.15) belonging to the four sets in (B) when changing from 15% to no additional variance (mean from five simulated data sets).
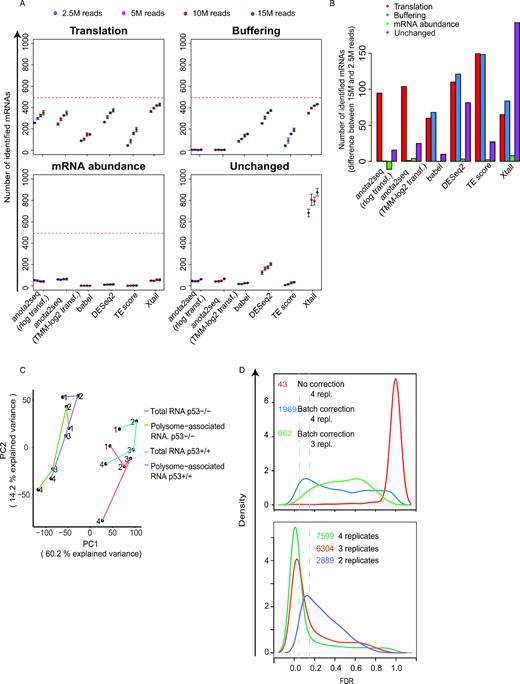
Evaluation of sensitivity to sequencing depth during analysis of changes in translational efficiency affecting protein levels. (A) Numbers of mRNAs identified as differentially translated from the translation (TP), buffering (FP), mRNA abundance (FP) or unchanged (FP) sets (Figure 1A) are indicated for each method at a 15% FDR threshold (mean and standard deviations from 5 simulated data sets are indicated) (B) Difference in the number of mRNAs identified as differentially translated (FDR < 0.15) belonging to the four sets in (A) when changing the sequencing depth from 15 million to 2.5 million reads (mean from 5 simulated data sets). Red lines indicate the total amount of mRNAs simulated for each set of regulated transcripts. (C) PCA analysis of the RNAseq data set from Liang et al. Lines connect replicate experiments (individual replicates are indicated by numbers). PC: Princinpal component (D) Density plots of adjusted p-values (FDRs) from analysis of changes in translational efficiencies leading to altered protein levels using anota2seq and RNAseq data from Liang et al. (top) or Guan et al. (bottom). Vertical line indicates a 5% and 15% FDR threshold. Numbers of identified mRNAs are reported at a 15% FDR threshold. All possible replicate combinations were analyzed when using three or two replicates and the mean number of identified mRNAs is indicated.
Anota2seq allows batch adjustment during statistical analysis
Polysome- or ribosome-profiling data sets can include batch effects commonly manifested as systematic differences between replicated experiments. Batch effects can lead to reduced power for detection of changes in translational efficiency and thus adjusting for batch effects during statistical analysis is warranted (54). We therefore implemented the possibility to use batch adjustment in anota2seq, which is applied during APV (18) and also affects parameters for variance shrinkage. To assess the impact of such batch adjustment on anota2seq analysis we selected a data set (11) harboring a systematic batch effect related to replicated experiments (Figure 5C) and applied anota2seq with and without batch adjustment. Batch adjustment led to a dramatic increase in identification of mRNAs with an FDR <15% for changes in translational efficiency which affect protein levels (Figure 5D, top). Therefore, batch adjustment should be considered during anota2seq analysis.
Assessing the need for replication in anota2seq analysis
Polysome- and ribosome-profiling data sets may include substantial variance. This indicates that sufficient replication is essential for efficient analysis. Because anota2seq requires three replicates in the case of two treatment groups (or two replicates when there are three or more treatment groups) due to the limitation of degrees of freedom in the APV model, we determined the effect of reducing the number of replicates from four to three on anota2seq performance using the data set with two conditions (Figure 5C) (11). Reducing the number of replicates from four to three decreased the number of transcripts identified with an FDR <0.15 for a change in translational efficiency affecting protein levels (Figure 5D, top). Thus, similar to what was previously reported for babel (23), anota2seq is sensitive to the number of replicate experiments although the precise number needed will depend on e.g. the magnitude of changes in translational efficiencies and the sequencing depth. It should also be noted that the batch adjustment reduces the degrees of freedom for the residual error in the APV model (18). Therefore, fewer replicates may be sufficient when analyzing data sets not requiring batch adjustment or with more than two conditions. Indeed, analysis of data from Guan et al. (36) with three conditions which did not require batch adjustment (see original publication) indicated sufficient power for detection of changes in translational efficiency altering protein levels at an 15% FDR threshold when using two replicates per condition (Figure 5D, bottom).
Anota2seq applied to ribosome-profiling data identifies translational buffering following RPS19 depletion
To assure that anota2seq can also be efficiently applied to ribosome-profiling data, we analyzed a previously published data set assessing the impact of knockdown of RPS19 (43). To this end, we performed the analysis considering only RPFs mapping to coding sequences (CDS) and compared these findings to a data set where RPFs were mapped to full-length transcripts (full transcript). Of note, a relatively low number of reads mapping to mRNA were obtained for RPFs as compared to reads originating from total mRNA sequencing libraries (Figure 6A). The number of RPF reads only mapping to the CDS was on average 20.3% lower as compared to full transcript mapping of RPFs (Figure 6A). Moreover, in a PCA, although there were larger distances between replicated conditions for RPF data as compared to total mRNA data (consistent with poorer reproducibility for RPF data), both mapping strategies achieved similar separation between RNA source (i.e. RPFs or total mRNA) and condition (Figure 6B). Anota2seq analysis of both these datasets revealed similar number of changes in total mRNA, RPFs and buffering as assessed by distributions of FDRs (Figure 6C) and comparable numbers of mRNA classified into the different modes of regulation (Figure 6D). Notably, consistent with the lower reproducibility of RPF samples and low number of reads (Figure 6A and B), few changes in translational efficiencies affecting protein levels could be detected (Figure 6C). As translational buffering emerged as the major post-transcriptional mode for regulation of gene expression upon silencing of RPS19, we compared whether the mapping strategy (i.e. CDS or full transcripts) for RPFs affected the set of identified buffered mRNAs. A Venn diagram-based comparison indicated a substantial number of genes identified regardless whether RPFs from CDSs or full transcripts were employed. Subsets of transcripts, however, were captured by one, but not both mapping approaches (Figure 6E). When applying statistics-based thresholds to compare results using Venn diagrams, identified differences may be due to small shifts in statistical significances and therefore not indicative of differences in patterns of regulation. To assess this, we considered mRNAs identified as buffered in the CDS-based analysis only, and visualized their fold changes as measured using full transcript mapping, and vice versa (Figure 6F). This revealed that the majority of such transcripts showed similar regulation in both datasets despite being suggested as distinctly identified depending on mapping strategy by the Venn diagram (Figure 6E). Thus, anota2seq can be efficiently applied to ribosome profiling data. Moreover, although the analysis suffers from a low number of RPF reads, this assessment suggests wide-spread translational buffering following silencing of RPS19. Furthermore, although read mapping strategies produced very similar results following anota2seq analysis, some transcripts may be concluded as regulated differently depending on whether RPFs are allowed to map to CDS or full transcripts. As this may have significant biological implications, mapping strategy should be considered when performing anota2seq analysis of ribosome-profiling data.
![Anota2seq analysis of ribosome-profiling data identifies translational buffering following RPS19 silencing. (A) Number of RNAseq reads from sequencing libraries for total mRNA mapping to full transcript and for RPF mapping to CDS or full transcript. (B) PCA plots of components 1 and 2 from analysis using data sets where RPFs were mapped to CDSs (left) or the full transcript (right) as input. (C) Density plot of FDRs following anota2seq analysis comparing RPS19 knock-down to control (shLuc) using the two data sets from (B) as input. (D) Scatter plots of log2 fold-changes (shRPS19 vs shLuc) for total mRNA and RPF data (CDS [left] or full transcript [right] RPF mapping). Numbers of identified transcripts under each mode of regulation are indicated. (E) A Venn diagram comparing transcripts identified as buffered from anota2seq analysis of the two data sets from (B). (F) Scatter plots of log2 fold-changes (shRPS19 versus shLuc) of total mRNA and RPF data (CDSs data [right] and full transcript [left]). Transcripts identified as buffered only when anota2seq was applied on the data sets where RPFs were mapped to the full transcript (left) or CDS (right) are indicated (i.e. corresponding to [E]). Note: not all mRNAs identified during analysis of the full transcript data set were represented in the CDS data set (due to filtering [see materials and methods]).](https://oup.silverchair-cdn.com/oup/backfile/Content_public/Journal/nar/47/12/10.1093_nar_gkz223/1/m_gkz223fig6.jpeg?Expires=1716405263&Signature=ItGm~g1xSub11h2ZMMoxLYSYZuTyX63~iWvxaind41SpVIRCcQWvQTmQQSftvW5QAYlEBGOklmjUJtGMBX~dGQ-~fwhqFQkWU9C8mollOC3UKKdIW6qBRaHUumOEyG2A5cMBC~qfmJVxaVlOTeEa6MoJpBwAMrFhwzyYSL8wqjrRJY6HAPHsTawcLEYeNXp3eZk1LKZGuCcpVE1e~59xx-jf6oKCftRefY4TEOu6sqVuj~YIUp4igIDnANEIkL85mFU3OZVB8BytpD1fUlBW2p7UYsyBpr1uVgOfF2kwOLbLmbbmC1GbMxqgj35c6ysW0rFlp99ZghbHmFr5DXL2zg__&Key-Pair-Id=APKAIE5G5CRDK6RD3PGA)
Anota2seq analysis of ribosome-profiling data identifies translational buffering following RPS19 silencing. (A) Number of RNAseq reads from sequencing libraries for total mRNA mapping to full transcript and for RPF mapping to CDS or full transcript. (B) PCA plots of components 1 and 2 from analysis using data sets where RPFs were mapped to CDSs (left) or the full transcript (right) as input. (C) Density plot of FDRs following anota2seq analysis comparing RPS19 knock-down to control (shLuc) using the two data sets from (B) as input. (D) Scatter plots of log2 fold-changes (shRPS19 vs shLuc) for total mRNA and RPF data (CDS [left] or full transcript [right] RPF mapping). Numbers of identified transcripts under each mode of regulation are indicated. (E) A Venn diagram comparing transcripts identified as buffered from anota2seq analysis of the two data sets from (B). (F) Scatter plots of log2 fold-changes (shRPS19 versus shLuc) of total mRNA and RPF data (CDSs data [right] and full transcript [left]). Transcripts identified as buffered only when anota2seq was applied on the data sets where RPFs were mapped to the full transcript (left) or CDS (right) are indicated (i.e. corresponding to [E]). Note: not all mRNAs identified during analysis of the full transcript data set were represented in the CDS data set (due to filtering [see materials and methods]).
DISCUSSION
Modulation of translation underlies numerous biological and pathological processes ranging from stress response and cancer (55) to learning and memory (56). Nonetheless, translatomes are vastly under-studied in comparison to transcriptomes (which reflect mRNA abundance determined at the level of transcription and/or mRNA stability) (7). Stringent and efficient application of transcriptome-wide methods to measure changes in translation are therefore required to advance knowledge regarding the role of translation in homeostasis and disease. Moreover, sufficient replication and efficient data analysis is crucial for deriving valid conclusions. Notwithstanding the noisy nature of polysome- and ribosome-profiling data, it is often paradoxically suggested that algorithms for identification of differential translation do not require replication (22). This does not seem to be consistent with concerns about reproducibility in quantitative biology, which instead suggests that sufficient experimental replication is essential to derive meaningful conclusions. Consistently, we reveal that analysis using Xtail on datasets with one replicate is associated with exceptionally high rates of false positive findings (Supplementary Figure S1B).
Currently, polysome- and ribosome-profiling are most commonly used methods to interrogate translatomes whereby polysome-profiling is more efficient for identification of changes in translational efficiency (12,14), while ribosome-profiling generates information about ribosome positioning at a single nucleotide resolution (57,58). A powerful unique property of polysome-profiling is that it allows examination of 5′ and/or 3′UTRs of translated mRNAs, thereby facilitating identification of regulatory elements as well as potential differences in translation of mRNA isoforms co-expressed but differing in their 5′ or 3′UTRs (12). Ribosome- and polysome-profiling therefore represent complementary methodologies providing ample opportunity to study translatomes. Hence, there is interest to develop efficient algorithms to analyze polysome- and ribosome-profiling data. Analyses of changes in bona fide translational efficiencies need to be adapted to advances in technology that bear distinct characteristics, such as the count nature of RNAseq data, but also has to parallel the understanding of mechanisms regulating mRNA translation. Translational buffering represents one such mechanism of translation control wherein alterations in mRNA levels are compensated at the level of translation such that levels of polysome-associated mRNAs or RPFs are not affected by changes in mRNA abundance (4,16,29,30,32). Translational buffering is thus expected to retain protein levels despite changes in mRNA levels.
Herein, we developed the anota2seq algorithm, which can be employed to analyze DNA-microarray and RNAseq data and efficiently identify and separate changes in translational efficiency affecting protein levels and translational buffering. Evaluation of anota2seq compared to other methods for translatome analyses indicated superior performance of anota2seq in detecting differential translation with low type-1-error rates and robustness against noise and varying sequencing depths. Importantly, anota2seq is applicable to both polysome- and ribosome-profiling studies. This highlights the effectiveness of anota2seq analysis for various types of data and the need to consider translational buffering during analysis of translatomes given that this mode for regulation of gene expression appears to be prevalent in multiple systems (29–35). One unexpected finding was the poor performance of Xtail under the NULL condition inasmuch as a large number of mRNAs were identified as differentially translated despite no true changes in their translational efficiency (Figure 1C, Supplementary Figures S1B and S2D). This most likely stems from incorrect assumptions regarding data independence in the models applied by Xtail (22). Indeed, assessing the performance under the NULL condition during algorithm development to derive tools that can be used for efficient and valid analysis is critical. Moreover, anota2seq has several distinct features as compared to other methods: (i) it is not based on interpretation of differences between log-ratios and hence will not be affected by spurious correlations; (ii) it distinguishes changes in translation efficiency affecting protein levels from translational buffering; (iii) it allows for gene-level batch correction and (iv) it permits analysis of polysome-associated and total mRNA changes using the same analytical methods thereby allowing simple and comparable identification of changes in polysome-associated mRNA, total mRNA, translational efficiency affecting protein levels and buffering.
Although, using simulated data, rlog and TMM-log2 approaches performed similarly, prudence is advised when selecting normalization/transformation methods for anota2seq analysis, as technological biases not tested herein may influence outcomes. Anota2seq therefore incorporates both TMM-log2 and rlog but also allows the user to supply custom transformed and normalized data.
In summary, we designed anota2seq for analysis of mRNA translation which can be applied independent of platform used for quantification. Application of such statistically stringent analyses holds a promise to critically improve understanding of the role of translation in health and disease.
DATA AVAILABILITY
The anota2seq software is available as a Bioconductor package. (http://bioconductor.org/packages/release/bioc/html/anota2seq.html)
Four datasets were retrieved from GEO (38) with accession numbers GSE99909, GSE90070, GSE35469 and GSE89183. One dataset was retrieved from ArrayExpress (41) with accession number E-MEXP-958
SUPPLEMENTARY DATA
Supplementary Data are available at NAR Online.
ACKNOWLEDGEMENTS
I.T. acknowledges Prof. R. McInnes for invaluable advice.
Author contributions: C.O., L.F., I.T. and O.L. designed the study. C.O., J.L., C.M. and O.L. developed the anota2seq method. C.O., J.L. and O.L. developed the anota2seq software. C.O., J.L., L.F., I.T. and O.L. analyzed and interpreted the data. C.O., J.L., L.F., I.T. and O.L. wrote the manuscript.
FUNDING
Swedish Research Council; Swedish Cancer Society; Cancer Society in Stockholm; Wallenberg Academy Fellows Program; STRATCAN grants (to O.L.); Canadian Institutes for Health Research [MOP-363027]; National Institutes of Health [R01 CA 202021-01-A1 to I.T.] who is a Junior 2 Research Scholar of the Fonds de Recherche du Québec – Santé (FRQ-S); Joint Canada-Israel Health Research Program (JCIHRP) [108589-001 to I.T. and O.L.]; Department of Health and Human Services acting through the Victorian Cancer Agency [MCRF16007 to L.F.]; National Health and Medical Research Council (NHMRC) [APP1141339 to O.L., I.T. and L.F.] Funding for open access charge: Vetenskapsrådet.
Conflict of interest statement. None declared.
REFERENCES

Comments