


Abstract
Experimental and epidemiological studies suggest a protective role for vitamin D in colorectal carcinogenesis, but evidence is inconclusive. Circulating 25-hydroxyvitamin D (25(OH)D) concentrations that minimize risk are unknown. Current Institute of Medicine (IOM) vitamin D guidance is based solely on bone health.
We pooled participant-level data from 17 cohorts, comprising 5706 colorectal cancer case participants and 7107 control participants with a wide range of circulating 25(OH)D concentrations. For 30.1% of participants, 25(OH)D was newly measured. Previously measured 25(OH)D was calibrated to the same assay to permit estimating risk by absolute concentrations. Study-specific relative risks (RRs) for prediagnostic season-standardized 25(OH)D concentrations were calculated using conditional logistic regression and pooled using random effects models.
Compared with the lower range of sufficiency for bone health (50–<62.5 nmol/L), deficient 25(OH)D (<30 nmol/L) was associated with 31% higher colorectal cancer risk (RR = 1.31, 95% confidence interval [CI] = 1.05 to 1.62); 25(OH)D above sufficiency (75–<87.5 and 87.5–<100 nmol/L) was associated with 19% (RR = 0.81, 95% CI = 0.67 to 0.99) and 27% (RR = 0.73, 95% CI = 0.59 to 0.91) lower risk, respectively. At 25(OH)D of 100 nmol/L or greater, risk did not continue to decline and was not statistically significantly reduced (RR = 0.91, 95% CI = 0.67 to 1.24, 3.5% of control participants). Associations were minimally affected when adjusting for body mass index, physical activity, or other risk factors. For each 25 nmol/L increment in circulating 25(OH)D, colorectal cancer risk was 19% lower in women (RR = 0.81, 95% CI = 0.75 to 0.87) and 7% lower in men (RR = 0.93, 95% CI = 0.86 to 1.00) (two-sided Pheterogeneity by sex = .008). Associations were inverse in all subgroups, including colorectal subsite, geographic region, and season of blood collection.
Higher circulating 25(OH)D was related to a statistically significant, substantially lower colorectal cancer risk in women and non–statistically significant lower risk in men. Optimal 25(OH)D concentrations for colorectal cancer risk reduction, 75-100 nmol/L, appear higher than current IOM recommendations.
Vitamin D, obtained through sun exposure, natural and fortified foods, and dietary supplements, is hypothesized to lower colorectal cancer risk via antiproliferative, pro-apoptotic, and anti-angiogenic properties (1). Many prospective cohort studies have reported a non–statistically significant lower risk of colorectal cancer with higher prediagnostic concentrations of 25-hydroxyvitamin D (25(OH)D), the accepted measure of vitamin D status (2). However, because individual studies have used different assays and laboratories, and vitamin D concentrations differ noticeably across assay methods (3), these studies, and the meta-analyses that combine them, are unable to explore the vitamin D–colorectal cancer relationship on the same absolute scale. Further, individual studies have had limited power to examine associations by sex and other population characteristics (4). The relatively few randomized clinical trials (RCTs) of vitamin D supplementation and colorectal cancer or adenoma have not demonstrated statistically significant effects (5,6); but study size, duration and timing of supplementation, and compliance may have contributed to the null findings (5,7). In addition, the RCTs could not evaluate a wide range of vitamin D exposures.
In 2011, the Institute of Medicine (IOM; now the National Academy of Medicine) concluded that evidence of vitamin D benefits for cancer was insufficient to inform Dietary Reference Intakes for vitamin D and that more research was needed. Of the cancers, the most evidence for a protective role for vitamin D existed for colorectal cancer, but IOM experts stated that the dose-response relationship was speculative. Therefore, IOM based its dietary intake recommendations and suggestions for circulating 25(OH)D concentrations solely on bone health research (8).
To leverage the variation in circulating 25(OH)D across populations and to identify optimal concentrations for colorectal cancer risk reduction, we examined the association between circulating 25(OH)D and subsequent colorectal cancer incidence in 17 prospective cohorts participating in the international Circulating Biomarkers and Breast and Colorectal Cancer Consortium. We harmonized and pooled participant-level data and based all 25(OH)D measures on a single, widely accepted assay and laboratory. This approach facilitated the examination of colorectal cancer risk over a wide range of absolute 25(OH)D blood concentrations and permitted comparison of our findings with public health recommendations.
Methods
Study Design
Seventeen cohorts participated in this pooling project (Table 1) (9–25). Prospective studies were eligible for inclusion if they had prediagnostic 25(OH)D data or stored prediagnostic blood samples for at least 50 male or 50 female colorectal cancer case participants. Control participants were selected using incidence density sampling and were matched on sex, age, date of blood draw, and other study-specific factors (Supplementary Methods, available online); most were matched one control participant per case participant. Men and women in the same cohort were analyzed separately. Each cohort and the consortium received approval from its respective institutional review board.
Descriptive characteristics of participating cohorts
| Cohort | Country or continent | % female | Colorectal cancer case/control participants, No. | Median calibrated and season-standardized 25(OH)D in control participants (10%–90%)*, nmol/L | Median original 25(OH)D in control participants (10%–90%), nmol/L | Median age at blood draw(10%–90%)†, y | Years of blood draw† | Median years to diagnosis (10%–90%) |
|---|---|---|---|---|---|---|---|---|
| Outside US | ||||||||
| Alpha-Tocopherol, Beta-Carotene Cancer Prevention Study (ATBC1 and ATBC2)‡,§ | Finland | 0 | 129/250 | 47 (29–79) | 34 (19–62) | 59 (52–67) | 1985–1988 | 3.5 (0.9–6.3) |
| 369/369 | 44 (27–74) | 31 (14–61) | 57 (51–65) | 12.5 (7.7–17.2) | ||||
| Breakthrough Generations Study (BGS)‖ | UK | 100 | 92/92 | 50 (23–82) | 48 (23–85) | 60 (47–74) | 2004–2009 | 2.3 (0.8–4.6) |
| European Investigation into Cancer and Nutrition (EPIC)§ | Europe | 49.8 | 1223/1223 | 42 (27–63) | 58 (32–98) | 59 (50–67) | 1992–1999 | 3.6 (0.9–6.7) |
| JANUS Serum Bank (JANUS)§ | Norway | 51.1 | 380/380 | 65 (41–95) | 60 (37–89) | 44 (40–61) | 1972–2002 | 15.6 (5.1–25.4) |
| Japan Public Health Center–based Prospective Study (JPHC)§ | Japan | 48.6 | 367/733 | 64 (53–78) | 62 (43–87) | 58 (47–67) | 1990–1995 | 5.1 (1.1–10.2) |
| Hormones and Diet in the Etiology of Breast Cancer (ORDET)‖ | Italy | 100 | 130/130 | 33 (18–61) | 30 (13–66) | 53 (42–65) | 1987–1992 | 10.8 (3.8–16.0) |
| US | ||||||||
| Beta-Carotene and Retinol Efficacy Trial (CARET)‖,¶ | US | 0 | 123/123 | 52 (33–86) | 53 (27–86) | 64 (54–69) | 1987–1996 | 4.9 (1.0–10.7) |
| CLUE II: Campaign Against Cancer and Heart Disease (CLUE II)‖ | US | 54.9 | 288/288 | 49 (19–87) | 63 (34–102) | 62 (46–75) | 1989 | 9.0 (1.8–17.3) |
| Cancer Prevention Study–II (CPS-II)‖ | US | 51.0 | 288/288 | 63 (35–91) | 64 (36–92) | 72 (64–79) | 1998–2001 | 3.2 (0.7–6.2) |
| Health Professionals Follow-up Study (HPFS)§ | US | 0 | 267/517 | 71 (47–94) | 72 (45–99) | 68 (53–75) | 1993–1995 | 6.3 (1.4–11.4) |
| Multiethnic Cohort Study (MEC)§ | US | 35.4 | 183/346 | 64 (36–95) | 60 (30–96) | 69 (57–79) | 1995–2006 | 1.5 (0.3–3.3) |
| Nurses’ Health Study (NHS)§ | US | 100 | 348/694 | 64 (41–95) | 60 (38–87) | 60 (49–67) | 1989–1991 | 9.6 (2.1–16.2) |
| New York University Women’s Health Study (NYU WHS)‖ | US | 100 | 235/235 | 55 (34–91) | 57 (30–89) | 58 (44–64) | 1985–1991 | 12.3 (2.5–18.9) |
| Physicians’ Health Study (PHS)§ | US | 0 | 224/379 | 61 (43–88) | 61 (35–97) | 57 (46–68) | 1982–1983 | 9.5 (2.6–15.4) |
| Prostate, Lung, Colorectal and Ovarian Cancer Screening Trial (PLCO)‖ | US | 43.3 | 473/473 | 55 (29–87) | 56 (29–86) | 65 (58–72) | 1993–2001 | 5.4 (0.2–11.3) |
| Women’s Health Initiative (WHI)§ | US | 100 | 290/290 | 50 (33–80) | 44 (18–86) | 67 (57–75) | 1994–2009 | 3.2 (0.6–6.5) |
| Women’s Health Study (WHS)‖ | US | 100 | 297/297 | 54 (31–89) | 57 (32–91) | 58 (48–69) | 1993–1995 | 8.0 (2.3–13.4) |
| Total | 50.6 | 5706/7107 | 56 (31–85) | 58 (29–91) | 60 (48–72) | 1972–2009 | 5.5 (1.1–15.0) | |
Newly measured or calibrated, season-standardized circulating 25(OH)D. from nmol/L SI conversion factors: To convert 25(OH)D from nmol/L to ng/mL, divide values by 2.496. 25(OH)D = 25-hydroxyvitamin D.
In case and control participants combined.
Data from the two publications from the ATBC cohort were analyzed as separate studies because the case participants were from different nonoverlapping follow-up periods, and 25(OH)D assays were conducted at different laboratories and times.
Calibration studies: for each study that had previously measured circulating 25(OH)D, approximately three samples were selected from within each decile of the 25(OH)D distribution in the control participants (n = 29 samples) in that study and re-assayed during 2011–2013 using the same assay and laboratory used to measure 25(OH)D concentrations in the new studies. These results were then used to calibrate the previously measured 25(OH)D data for all case and control participants in that study to the assay used in the new studies.
New studies: Circulating 25(OH)D was analyzed with a direct, competitive chemiluminescence immunoassay at Heartland Assays (Ames, IA) from November 2011 through April 2013.
Only men from the CARET study were included in the analyses due to too few colorectal cancers diagnosed among women (n < 50).
25(OH)D Assays
For the eight cohorts without circulating 25(OH)D data (30.1% of participants), 25(OH)D was measured for case and control participants at Heartland Assays, LLC (Ames, IA), using a direct, competitive chemiluminescence immunoassay. Laboratory personnel were blinded to case–control participant status. For the other nine cohorts that had previously assayed 25(OH)D, 25(OH)D measurements were calibrated to the Heartland Assays immunoassay. For each of these studies, approximately three control participants were selected within each decile of the 25(OH)D distribution, re-assayed at Heartland Assays, and used to calibrate the previously measured 25(OH)D data for the study using robust linear regression (Supplementary Methods, available online) (26). Each assay batch included blinded quality control samples from individual studies and National Institute of Standards and Technology (NIST) standard reference materials. Coefficients of variation, including within- and between-batch variability, were 5%–13% for the study-specific quality controls and 16%, 9%, and 9%, respectively, for the NIST reference materials at 17.7, 32.3, and 49.8 nmol/L.
Data Collection
Each cohort provided participant-level data on demographic, lifestyle, and medical risk factors, ascertained close to the time of blood collection and before diagnosis, and for case participants, tumor subsite and stage. All variables were harmonized centrally to create uniform definitions across studies.
Outcome
First primary colorectal cancers (International Classification of Diseases for Oncology codes: C18.0, C18.2–C18.9) were ascertained via medical or health insurance record review, linkage with population-based cancer registries, self-report, and/or follow-up with physicians or next of kin.
Statistical Analysis
To adjust for seasonal variation in circulating 25(OH)D, for each study, we regressed 25(OH)D concentrations in control participants on week of blood draw using sine–cosine functions (27). A season-standardized value for each participant was calculated by adding the participant’s residual from the regression to the study-specific predicted mean in control participants (regression intercept). This value represents the participant’s circulating 25(OH)D averaged over the entire year according to the seasonal variation observed in the individual study. All reported 25(OH)D values are season-standardized unless otherwise noted.
Circulating 25(OH)D concentrations were categorized using consortium-wide sex-specific quintiles based on the distribution in control participants, or IOM-suggested cut-points (8). Restricted cubic spline analyses using aggregated models, which combined all studies into a single data set and analyzed them together while controlling for study, indicated that the 25(OH)D–colorectal cancer association was consistent with linearity (Pnonlinearity > .05). Therefore, we also modeled circulating 25(OH)D as a continuous variable.
A two-stage approach was used to estimate pooled relative risks (RRs). Study-specific log relative hazards were calculated by conditional logistic regression for the nested case-control studies (28) and then combined using random effects models (29). Model 1 was conditioned on study-specific matching factors. Model 2 also included body mass index (BMI) and physical activity. The fully adjusted model (model 3) additionally included established and suspected colorectal cancer risk factors (Supplementary Methods, available online). Dietary factors, including calcium, fiber, folate, and red and processed meat, were considered but had negligible impact on results and were therefore not included in the final model.
Heterogeneity among studies was evaluated using the Q statistic (29,30). Wald statistics for trend used the median 25(OH)D of each category. Effect modification by colorectal cancer risk factors, season of blood draw, geography, and time between blood draw and diagnosis was evaluated using meta-regression (31); differences by cancer subsite were assessed using a contrast test (32). Additional study methods are provided in the Supplementary Methods (available online).
All P values were based on two-sided tests and considered statistically significant if the P value was less than .05. Analyses were conducted using SAS version 9.3 (Cary, NC).
Results
This analysis included 5706 colorectal cancer case participants and 7107 control participants from prospective cohorts in the United States (n = 11), Europe (n = 5), and Asia (n = 1) (Table 1). Overall, 50.6% of participants were women and most were white (83.9%). Median (10th–90th percentile) age at blood draw was 60 (48–72) years, and median time from blood draw to diagnosis was 5.5 (1–15) years. Median circulating 25(OH)D in control participants, after calibration and season standardization, was 56 (31–85) nmol/L overall, 54 (29–83) nmol/L in women, and 58 (34–86) nmol/L in men. Among the cohorts that had previously measured 25(OH)D, calibrated, season-standardized medians ranged from 27.6% lower to 41.9% higher than the original 25(OH)D.
As 25(OH)D measurements from each study were based on the same assay, we created consortium-wide sex-specific quintiles to take advantage of the wide range of circulating 25(OH)D across studies. We used the third quintile as the referent to avoid excluding the one study with no case participants in the lowest quintile in the pooled analyses (Table 2). In a conditional logistic regression model with no added covariates (model 1), participants in the lowest 25(OH)D quintile had a 23% higher risk of colorectal cancer (RR = 1.23, 95% confidence interval [CI] = 1.06 to 1.43), and those in the highest quintile had a 21% lower risk (RR = 0.79, 95% CI = 0.68 to 0.92) (quintile cut-points provided in Table 2). Adjustment for BMI and physical activity (Model 2) minimally impacted the risk estimates. In the model including all recognized nondietary colorectal cancer risk factors plus alcohol consumption (Model 3), these associations persisted. Participants in quintiles 1 and 5 had 15% higher (RR = 1.15, 95% CI = 0.97 to 1.38) and 22% lower risks (RR = 0.78, 95% CI = 0.65 to 0.94), respectively, than quintile 3 (Ptrend < .001). Excluding one study at a time revealed that no individual study substantially influenced the results (data not shown). The inverse trend was statistically significant in women (Ptrend < .001) and weaker and not statistically significant in men (Ptrend = .20). The difference by sex was most apparent at high 25(OH)D concentrations (Pheterogeneity by sex = .72 and .02 in the first and fifth quintiles, respectively).
Pooled associations of consortium-wide, sex-specific quintiles and continuous concentrations of 25(OH)D with colorectal cancer
| Model | Consortium-wide, sex-specific quintiles of circulating 25(OH)D*
|
Per 25 nmol/L of circulating 25(OH)D*
|
|||||||||
|---|---|---|---|---|---|---|---|---|---|---|---|
| RR (95% CI)
|
Ptrend‡ | Phet by study§ | Phet by sex‖ | RR (95% CI) | Phet by study§ | Phet by sex‖ | |||||
| Q1 | Q2 | Q3† | Q4 | Q5 | |||||||
| Overall | |||||||||||
| Case/control participants | 1519/1421 | 1247/1421 | 1094/1423 | 957/1421 | 889/1421 | ||||||
| Model 1¶ | 1.23 (1.06 to 1.43) | 1.02 (0.89 to 1.18) | 1.00 | 0.91 (0.80 to 1.04) | 0.79 (0.68 to 0.92) | <.001 | .17, .12 | .50, .02 | 0.85 (0.80 to 0.89) | .28 | .01 |
| Model 2# | 1.21 (1.02 to 1.42) | 1.01 (0.87 to 1.17) | 1.00 | 0.93 (0.82 to 1.07) | 0.80 (0.68 to 0.95) | <.001 | .09, .06 | .62, .01 | 0.86 (0.81 to 0.91) | .20 | .01 |
| Model 3** | 1.15 (0.97 to 1.38) | 0.98 (0.83 to 1.16) | 1.00 | 0.92 (0.79 to 1.07) | 0.78 (0.65 to 0.94) | <.001 | .09, .06 | .72, .02 | 0.87 (0.82 to 0.92) | .41 | .008 |
| Women | |||||||||||
| 25(OH)D, nmol/L | <37 | 37–<49 | 49–<59 | 59–<72 | ≥72 | ||||||
| Case/control participants | 822/706 | 654/705 | 574/707 | 476/706 | 422/705 | ||||||
| Model 1¶ | 1.33 (1.11 to 1.59) | 1.02 (0.84 to 1.24) | 1.00 | 0.85 (0.71 to 1.01) | 0.67 (0.56 to 0.81) | <.001 | .43, .98 | 0.80 (0.74 to 0.85) | .89 | ||
| Model 2# | 1.29 (1.06 to 1.57) | 1.02 (0.85 to 1.23) | 1.00 | 0.87 (0.72 to 1.04) | 0.67 (0.56 to 0.82) | <.001 | .37, .94 | 0.80 (0.75 to 0.86) | .92 | ||
| Model 3** | 1.21 (0.97 to 1.52) | 1.00 (0.82 to 1.23) | 1.00 | 0.83 (0.66 to 1.05) | 0.67 (0.54 to 0.81) | <.001 | .27, .81 | 0.81 (0.75 to 0.87) | .82 | ||
| Men | |||||||||||
| 25(OH)D, nmol/L | <41 | 41–<53 | 53–<63 | 63–<76 | ≥76 | ||||||
| Case/control participants | 697/715 | 593/716 | 520/716 | 481/715 | 467/716 | ||||||
| Model 1¶ | 1.16 (0.91 to 1.49) | 1.03 (0.83 to 1.28) | 1.00 | 0.98 (0.83 to 1.17) | 0.91 (0.70 to 1.19) | .02 | .09, .02 | 0.89 (0.82 to 0.97) | .19 | ||
| Model 2# | 1.16 (0.88 to 1.53) | 1.01 (0.80 to 1.28) | 1.00 | 1.01 (0.84 to 1.22) | 0.95 (0.72 to 1.26) | .13 | .04, .02 | 0.91 (0.83 to 1.00) | .12 | ||
| Model 3** | 1.12 (0.84 to 1.49) | 0.98 (0.75 to 1.29) | 1.00 | 1.01 (0.83 to 1.22) | 0.93 (0.69 to 1.25) | .20 | .06, .02 | 0.93 (0.86 to 1.00) | .50 | ||
Consortium-wide, sex-specific quintiles and continuous concentration are based on newly measured and calibrated season-standardized circulating 25(OH)D. Quintile cut-points are based on the distributions in the control participants, separately for each sex, as shown. 25(OH)D = 25-hydroxyvitamin D; CI = confidence interval; het = heterogeneity; RR = relative risk.
Quintile 3 was used as the reference category because one cohort (Japan Public Health Center–based Prospective Study), with no case participants in consortium-wide quintile 1, would have been dropped from the analysis if quintile 1 was used as the reference category.
Ptrend value, two-sided test calculated using a continuous variable based on the median 25(OH)D in each quintile.
Pheterogeneity value, two-sided test for between-studies heterogeneity. Results are for quintile 1 and quintile 5 for quintile-based analyses and for β-coefficient for continuous analyses.
Pheterogeneity value, two-sided test for between-studies heterogeneity due to sex. Results are for quintile 1 and quintile 5 for quintile-based analyses and for β-coefficient for continuous analyses.
Model 1, conditioned on study-specific matching factors (Supplementary Methods, available online), including date of blood draw and age.
Model 2, model 1 adjusted for body mass index (<20, 20–<22.5, 22.5–<25, 25–<27.5, 27.5–<30, ≥30 kg/m2) and physical activity (study-specific tertiles of metabolic equivalents in hours/week, if available, or low, moderate, high).
Model 3, model 2 additionally adjusted for race (white, black, Asian, other, for studies that did not match on race); family history of colorectal cancer (yes, no); alcohol consumption (men: 0, >0–<5, 5–<15, 15–<30, ≥30 g/d; women: 0, >0–<5, 5–<15, ≥15 g/d); smoking status (never, former, current); aspirin and/or nonsteroidal anti-inflammatory drug use (yes, no for regular use, available for nine cohorts only); and in women, menopausal status and menopausal hormone therapy (postmenopausal/never hormone use, postmenopausal/former hormone use, postmenopausal/current hormone use, postmenopausal/missing hormone use, premenopausal, perimenopausal or missing menopausal status). For the European Prospective Investigation into Cancer and Nutrition, this variable was modeled as postmenopausal/not current hormone use and postmenopausal/current hormone use, and for the Japan Public Health Center–based Prospective Study, this variable was modeled as postmenopausal/never hormone use and postmenopausal/ever hormone use). All covariates included a missing category.
Sensitivity analyses with finer adjustment for both physical activity (which included only the 11 studies with sufficiently detailed information) and BMI minimally changed the pooled relative risks (data not shown). After excluding the first two years of follow-up (18.7% of participants) to evaluate the potential influence of preclinical disease, results were similar (17% higher risk for quintile 1, 20% lower risk for quintile 5) (data not shown).
Results were similar in two-stage analyses using random effects and fixed effects models and in aggregated analyses (Supplementary Table 1, available online). Aggregated analyses permitted directly comparing extreme quintiles as all studies, even those not contributing case participants to the reference group, could be included. The pooled RR comparing quintile 5 with quintile 1 from aggregated analyses was 0.71 (95% CI = 0.62 to 0.81) (Supplementary Table 1, available online).
When circulating 25(OH)D concentrations were categorized using absolute cut-points based on those suggested by IOM for bone health (8), control participants were distributed as follows: 25(OH)D <30 nmol/L: 8.8%; 30–<40 nmol/L: 13.4%; 40–<50 nmol/L: 16.5%; 50–<62.5 nmol/L: 23.2%; 62.5–<75 nmol/L: 18.9%; 75–<87.5 nmol/L: 10.5%; 87.5–<100 nmol/L: 5.0%; and ≥100 nmol/L: 3.5%. A statistically significant 31% higher risk (RR = 1.31, 95% CI = 1.05 to 1.62) (Figure 1, Table 3) was observed at 25(OH)D concentrations of less than 30 nmol/L, levels considered deficient, compared with 50–<62.5 nmol/L, the lower range of sufficiency (IOM defines sufficiency as 50–<75 nmol/L) (8). Circulating 25(OH)D concentrations of 75–<87.5 and 87.5–<100 nmol/L, ranges considered beyond sufficiency, were associated with statistically significant 19% (RR = 0.81, 95% CI = 0.67 to 0.99) and 27% (RR = 0.73, 95% CI = 0.59 to 0.91) lower risks of colorectal cancer, respectively. For 75–<100 nmol/L 25(OH)D, the risk was 22% lower (RR = 0.78, 95% CI = 0.67 to 0.92). However, at concentrations of 100 nmol/L or greater, risk did not continue to decline (RR = 0.91, 95% CI = 0.67 to 1.24, 3.5% of control participants).
Pooled associations of 25(OH)D for categories based on Institute of Medicine cut-points with colorectal cancer*
| Model | Circulating 25(OH)D, nmol/L, RR (95% CI)
|
Ptrend† | Phet by study‡ | Phet by sex§ | |||||||
|---|---|---|---|---|---|---|---|---|---|---|---|
| <30 | 30–<40 | 40–<50 | 50–<62.5 | 62.5–<75 | 75–<87.5 | 87.5–<100 | ≥100 | ||||
| Overall | |||||||||||
| Case/control participants | 735/625 | 908/954 | 1061/1176 | 1259/1649 | 896/1346 | 464/748 | 208/357 | 175/252 | |||
| Multivariable RR‖ | 1.31 (1.05 to 1.62) | 1.05 (0.88 to 1.24) | 1.05 (0.87 to 1.25) | 1.00 (ref) | 0.94 (0.83 to 1.07) | 0.81 (0.67 to 0.99) | 0.73 (0.59 to 0.91) | 0.91 (0.67 to 1.24) | <.001 | .13, .18 | .75, .56 |
| Women | |||||||||||
| Case/control participants | 468/389 | 499/496 | 568/593 | 649/824 | 410/632 | 181/318 | 100/165 | 73/112 | |||
| Multivariable RR‖ | 1.37 (1.08 to 1.75) | 1.08 (0.88 to 1.33) | 1.09 (0.89 to 1.35) | 1.00 (ref) | 0.88 (0.73 to 1.05) | 0.67 (0.52 to 0.86) | 0.67 (0.49 to 0.93) | 0.83 (0.53 to 1.31) | <.001 | .38, .34 | |
| Men | |||||||||||
| Case/control participants | 267/236 | 409/458 | 493/583 | 610/825 | 486/714 | 283/430 | 108/192 | 102/140 | |||
| Multivariable RR‖ | 1.28 (0.86 to 1.90) | 1.00 (0.75 to 1.35) | 1.03 (0.75 to 1.40) | 1.00 (ref) | 1.00 (0.82 to 1.23) | 0.96 (0.69 to 1.33) | 0.79 (0.58 to 1.07) | 0.95 (0.61 to 1.48) | .12 | .07, .14 | |
Concentrations are based on newly measured and calibrated season-standardized circulating 25(OH)D. Categories are based on Institute of Medicine (IOM) recommendations for bone health: deficiency (<30 nmol/L), insufficiency (30–<40 and 40–<50 nmol/L), sufficiency (50–<62.5 [referent] and 62.5–<75 nmol/L), and beyond sufficiency (75–<87.5, 87.5–<100, and ≥100 nmol/L). RR for 75–<100 nmol/L vs 50–<62.5 nmol/L = 0.78 (95% CI = 0.67 to 0.92) overall, 0.67 (95% CI = 0.54 to 0.83) for women, and 0.90 (95% CI = 0.68 to 1.18) for men. 25(OH)D = 25-hydroxyvitamin D; CI = confidence interval; het = heterogeneity; RR = relative risk.
Ptrend value, two-sided test calculated using a continuous variable based on the median 25(OH)D in each category.
Pheterogeneity two-sided test for between-studies heterogeneity. Results are for the lowest and highest categories, respectively.
Pheterogeneity two-sided test for between-studies heterogeneity due to sex. Results are for the lowest and highest categories, respectively.
Multivariable RR (equivalent to model 3 in Table 2), conditioned on study-specific matching factors (Supplementary Methods, available online), including date of blood draw and age, and additionally adjusted for body mass index (<20, 20–<22.5, 22.5–<25, 25–<27.5, 27.5–<30, ≥30 kg/m2); physical activity (study-specific tertiles of metabolic equivalents in hours/wk, if available, or low, moderate, high); race (white, black, Asian, other, for studies that did not match on race); family history of colorectal cancer (yes, no); alcohol consumption (men: 0, >0–<5, 5–<15, 15–<30, ≥30 g/d; women: 0, >0–<5, 5–<15, ≥15 g/d); smoking status (never, former, current); aspirin and/or nonsteroidal anti-inflammatory drug use (yes, no for regular use, available for nine cohorts only); and in women, menopausal status and menopausal hormone therapy (postmenopausal/never hormone use, postmenopausal/former hormone use, postmenopausal/current hormone use, postmenopausal/missing hormone use, premenopausal, perimenopausal or missing menopausal status). For the European Prospective Investigation into Cancer and Nutrition, this variable was modeled as postmenopausal/not current hormone use and postmenopausal/current hormone use, and for the Japan Public Health Center–based Prospective Study, this was modeled as postmenopausal/never hormone use and postmenopausal/ever hormone use). All covariates included a missing category.
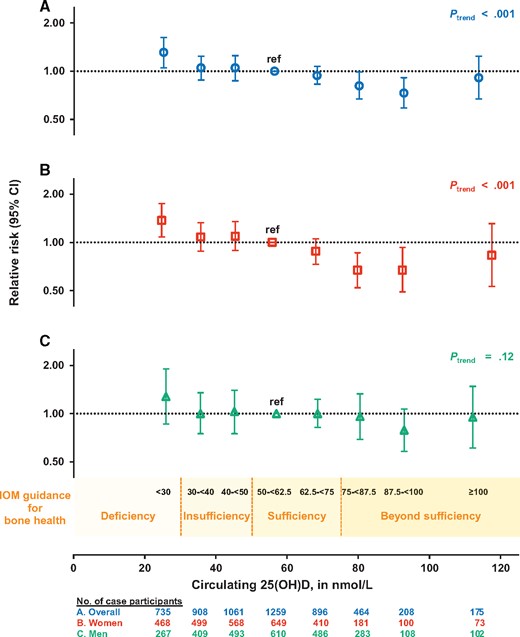
Pooled multivariable relative risks (RRs; indicated by open symbols) and 95% confidence intervals (CIs; indicated by vertical lines) of colorectal cancer according to categories of season-standardized circulating 25-hydroxyvitamin D (25(OH)D) concentrations (A) overall, (B) in women, and (C) in men. 25(OH)D categories correspond to Institute of Medicine (IOM) recommendations for bone health: deficiency was defined as <30 nmol/L; insufficiency includes 30–<40 and 40–<50 nmol/L; sufficiency includes 50–<62.5 (referent) and 62.5–<75 nmol/L; and beyond sufficiency includes 75–<87.5, 87.5–<100, and ≥100 nmol/L. The RR (95% CI) for each category is plotted at the median concentration of 25(OH)D among control participants in that category. The RRs for 75–<100 nmol/L, relative to 50–<62.5 nmol/L, are 0.78 (95% CI = 0.67 to 0.92) overall, 0.67 (95% CI = 0.54 to 0.83) for women, and 0.90 (95% CI = 0.68 to 1.18) for men (not shown in figure). Models were conditioned on study-specific matching factors, including date of blood draw and age, and were additionally adjusted for body mass index, physical activity, race, family history of colorectal cancer, alcohol consumption, smoking status, aspirin and/or nonsteroidal anti-inflammatory drug use, and, in women, menopausal status and menopausal hormone therapy. See the Supplementary Methods (available online) for individual studies excluded in specific 25(OH)D categories due to low numbers of participants. Two-sided Ptrend value was calculated using a continuous variable based on the median 25(OH)D in each category. 25(OH)D = 25-hydroxyvitamin D; CI = confidence interval; IOM = Institute of Medicine.
In continuous models, each 25 nmol/L increase in circulating 25(OH)D was associated with a statistically significantly lower risk of colorectal cancer in women and men combined (RR = 0.87, 95% CI = 0.82 to 0.92) and in women (RR = 0.81, 95% CI = 0.75 to 0.87), and with a non–statistically significantly lower risk in men (RR = 0.93, 95% CI = 0.86 to 1.00, Pheterogeneity by sex = .008) (Table 2).
Nearly all of the individual study relative risks for a 25 nmol/L increment in 25(OH)D were inverse, but only five reached statistical significance (Figure 2), whereas the pooled relative risk was highly statistically significant (P = 3.4×10⁻⁷). Associations per a 25 nmol/L increase in 25(OH)D were not statistically significantly different across subpopulations defined by demographic and lifestyle factors, season of blood collection, geographical location, or time from blood draw to diagnosis (Figure 3). Similar statistically significant inverse associations were observed for colon and rectal cancer. Associations appeared stronger for proximal compared with distal colon cancer, but results were not statistically significantly different (Figure 3; Supplementary Table 2, available online).
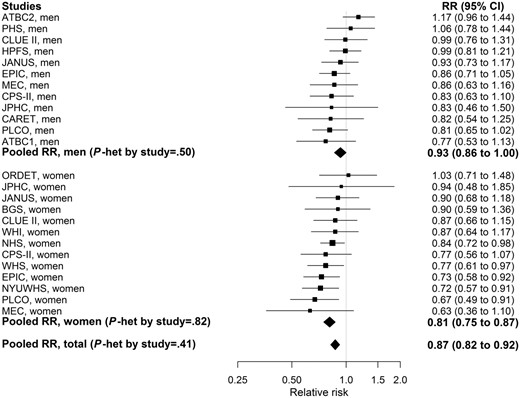
Study-specific and pooled multivariable relative risks (RRs; indicated by solid squares and diamonds, respectively) and 95% confidence intervals (CIs; indicated by horizontal lines) of colorectal cancer per 25 nmol/L increment in season-standardized circulating 25-hydroxyvitamin D (25(OH)D). The size of the square is proportional to the inverse of the variance of the study-specific RR. Full cohort names are listed in Table 1. An RR of 1.0, marked by the vertical line, indicates no association. Models were conditioned on study-specific matching factors, including date of blood draw and age, and were additionally adjusted for body mass index, physical activity, race, family history of colorectal cancer, alcohol consumption, smoking status, aspirin and/or nonsteroidal anti-inflammatory drug use, and, in women, menopausal status and menopausal hormone therapy. Two-sided Pheterogeneity value for between-studies heterogeneity was calculated using the Q statistic. CI = confidence interval; RR = relative risk.
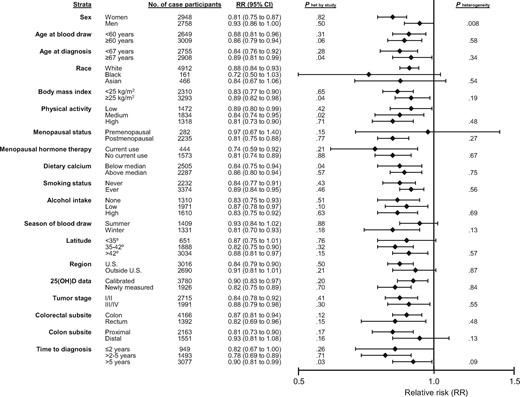
Pooled multivariable relative risks (RRs; indicated by solid diamonds) and 95% confidence intervals (95% CIs; indicated by horizontal lines) of colorectal cancer per 25 nmol/L increment in season-standardized circulating 25-hydroxyvitamin D (25(OH)D) stratified by demographic, lifestyle, and other factors and tumor characteristics. An RR of 1.0, marked by the vertical line, indicates no association. Summer- and winter-specific RRs were not standardized by season. Conditional models were used for stratified analyses by sex, age at diagnosis, region, 25(OH)D data, tumor stage, colorectal and colon subsite, and time to diagnosis. These models were conditioned on study-specific matching factors, including date of blood draw and age, and were additionally adjusted for body mass index, physical activity, race, family history of colorectal cancer, alcohol consumption, smoking status, aspirin and/or nonsteroidal anti-inflammatory drug use, and, in women, menopausal status and menopausal hormone therapy, except in models stratified by that variable. Unconditional models, which were used for the remaining stratified analyses, were adjusted for study-specific matching factors including date of blood draw and age, and the covariates listed above. See the Supplementary Methods (available online) for individual studies excluded in specific strata due to low numbers of participants (n < 25). Pheterogeneity value for between-studies heterogeneity was calculated using the Q statistic, except for race. Due to small numbers of nonwhites within most individual cohorts, analyses stratified by race were conducted using aggregated data, adjusted for study. Pheterogeneity value for heterogeneity across strata, except for race, tumor stage, and subsite, was calculated using meta-regression. Statistical significance for interaction by race was assessed using a Wald test. Evaluation of common effects by tumor stage and subsite was assessed using a contrast test. All statistical tests are two-sided. CI = confidence interval; RR = relative risk.
Discussion
In this international collaborative analysis of participant-level data for 5706 colorectal cancer case participants and 7107 control participants, colorectal cancer risk decreased steadily and statistically significantly with increasing prediagnostic circulating 25(OH)D up to 100 nmol/L. Circulating 25(OH)D of less than 30 nmol/L, considered deficient for bone health by the IOM, was associated with a 31% greater risk of colorectal cancer compared with 50–<62.5 nmol/L, the lower range of 25(OH)D considered sufficient for bone health (8). Colorectal cancer risk was lower at 25(OH)D concentrations higher than those considered sufficient for bone health: 19% and 27% lower risk for 75–<87.5 and 87.5–<100 nmol/L, respectively. At 25(OH)D concentrations of 100 nmol/L or greater, risk did not continue to decline. However, 25(OH)D concentrations of 100 nmol/L or greater were observed in only 3.5% of control participants; thus risk estimates for high 25(OH)D were imprecise. In continuous models, relative risks below 1.0 were observed in all subpopulations examined, including those defined by sex, colorectal subsite, geographic region, and season of blood collection. However, there was a statistically significant interaction by sex whereby the inverse association in women was stronger than that in men, most notably at higher circulating 25(OH)D.
Previous meta-analyses of prospective cohorts have reported statistically significant reductions in colorectal cancer risk for “high” vs “low” 25(OH)D (22,33) but have not taken into account the high variability in 25(OH)D measurements across assays and laboratories used in the included studies (3). In 2017, the World Cancer Research Fund/American Institute for Cancer Research Continuous Update Project, which reviewed data from 11 cohorts with prediagnostic circulating 25(OH)D, considered evidence for the role of vitamin D in colorectal carcinogenesis to be “limited” (2). Our consortium chose a single, widely accepted 25(OH)D assay for all new measurements, calibrated old measurements to the chosen assay, and adjusted for seasonal variation in vitamin D levels using a standardized approach across studies. This approach, still rare in pooled analyses of circulating biomarkers, enabled us to 1) generate exposure-risk relationships over a wide 25(OH)D range and 2) evaluate risk by 25(OH)D concentrations relevant to public policy. In addition, our standardized approach to harmonizing and analyzing primary participant-level data from all cohorts allowed us to control for confounding and examine risk subgroups and tumor subtypes uniformly, something not possible in meta-analyses.
At its initiation, this consortium included nearly all published prospective studies on 25(OH)D and colorectal cancer risk (nine cohorts), and then it expanded the study population by 43.0% by assaying 25(OH)D in eight additional cohorts (9–25). Four studies published after the initiation of our project (34–37) reported inverse associations, consistent with our findings. Each study included 225 or fewer case participants, and risk estimates were non–statistically significant. Similarly, results for continuous 25(OH)D from all but five of the individual studies participating in our consortium did not reach statistical significance. However, the pooled result was highly statistically significant (P = 3.4×10⁻⁷), demonstrating the value of pooling data.
The relatively few RCTs of supplemental vitamin D and colorectal cancer or adenoma have not demonstrated statistically significant effects. In the largest RCT, the Women’s Health Initiative (WHI), 400 IU vitamin D and 1000 mg calcium/d did not lower colorectal cancer risk in postmenopausal women (5). However, low dose, limited adherence, and absence of pre- and postintervention 25(OH)D data for all participants complicate interpretation of results (7). In addition, only 322 colorectal cancers were diagnosed during the trial. Other RCTs of vitamin D supplementation had smaller numbers of colorectal cancer outcomes (n = 2–158) (38). In a recent RCT, colorectal adenoma recurrence was not reduced by 1000 IU/d of vitamin D (with or without 1200 mg/d calcium) after three to five years (6). Five RCTs of high supplemental vitamin D doses (≥2000 IU/d) in men and women are currently ongoing (39). We anticipate that our current analysis, with precise estimates for colorectal cancer risk over a wide range of circulating 25(OH)D, will inform the interpretation of RCTs by suggesting the 25(OH)D concentrations at which colorectal cancer incidence is likely reduced.
Although an inverse association between circulating 25(OH)D and colorectal cancer risk was noted in both women and men, a provocative finding of this research is the stronger association observed in women, particularly at high 25(OH)D concentrations. The difference by sex was evident in the majority of cohorts that included both sexes. Earlier prospective observational studies hinted at a more pronounced association in women than men, but evidence was too limited to draw firm conclusions (4). The strength of some other colorectal cancer risk factors, such as obesity-related factors, has been found to differ by sex (40). Previous reports suggested that estrogen might influence vitamin D activity (41,42), and a reanalysis of the Women’s Health Initiative RCT indicated that supplemental vitamin D and calcium was associated with lower colorectal cancer risk only among women not randomly assigned to receive exogenous estrogen (43). However, we observed no effect modification by menopausal hormone therapy or menopausal status at the time of blood draw among women in our study, although the number of premenopausal participants was limited. The biological explanation for the more pronounced inverse association in women than men that we observed at high 25(OH)D concentrations is unclear and merits additional laboratory and epidemiologic research.
Vitamin D is best known for its critical role in regulating calcium homeostasis and bone mineral metabolism (8), but strong mechanistic evidence supports its importance in colorectal carcinogenesis (1,44). Experimental (45) and pilot trial data (44) report antiproliferative, pro-differentiation, and pro-apoptotic effects of vitamin D. The nuclear vitamin D receptor (VDR), present in many tissues including the large bowel, influences expression of 3%–5% of the human genome (1), including many genes involved in cell cycle regulation. Circulating 25(OH)D is the precursor to the active form of vitamin D (1,25(OH)2D), which binds to VDR to modulate gene transcription. Local synthesis and degradation of 1,25(OH)2D by the enzymes CYP27B1 and CYP24A1, respectively, occurs in an autocrine/paracrine fashion in many tissues, including colorectal mucosa. In human rectal mucosa, vitamin D supplementation upregulates CYP27B1 and CYP24A1 expression and modulates expression of the adenomatous polyposis coli gene (APC) and cell cycle regulation pathways (44). Additional potential mechanisms for vitamin D activity specific to the large bowel include promoting detoxification of DNA-damaging lithocholic acid (46) and improving gut mucosal integrity (47) and immunity (48).
Strengths of this study include harmonization of participant-level data on exposures and outcomes from 17 cohorts and analysis with a common statistical approach, thereby removing the potential heterogeneity present in meta-analyses of the published literature. The vast majority of the prospective data on circulating 25(OH)D and colorectal cancer available worldwide have been included, markedly reducing the potential for publication bias. Our calibration of previously collected 25(OH)D measurements to the same widely accepted assay and laboratory used for the new measurements enabled us to control for assay differences across studies and examine risk on the same absolute scale. Our approach permitted a more comprehensive examination of vitamin D–colorectal cancer relationships in population subgroups, by tumor subsites, and across the range of 25(OH)D concentrations than possible in individual studies or meta-analyses. Only studies that collected blood samples before colorectal cancer diagnosis were included, which reduced the possibility of the disease altering circulating 25(OH)D.
We have also considered potential limitations of our study. Both obesity and physical inactivity are independent colorectal cancer risk factors and are inversely correlated with circulating 25(OH)D (49). However, adjustment for both variables, even using finer categorizations available for a subset of studies, had minimal impact on our results. Further, adjustment for established colorectal cancer risk factors, including dietary factors, did not attenuate risk estimates. Minimal confounding by accepted risk factors adds to our confidence in the validity of our findings and strengthens the evidence for causality. Our results are based on a single blood draw, at a median of 5.5 years before diagnosis, which may be an imperfect measure of long-term 25(OH)D status. However, within-individual correlation coefficients for repeat measures of circulating 25(OH)D 1-11 years apart are 0.53–0.81, indicating that a single blood sample can provide relatively stable estimates (21,50). Finally, despite the large size of the consortium, we had limited power to examine associations at 25(OH)D concentrations greater than 100 nmol/L and in some racial/ethnic subgroups. Future research should evaluate associations at very high 25(OH)D levels, as these levels may now be more common (39), and in subgroups not well represented in our cohorts.
In summary, by demonstrating a strong, statistically significant, and robust inverse association between prediagnostic circulating vitamin D and colorectal cancer risk, we substantially strengthen the evidence, previously considered inconclusive, for a causal relationship. Our study estimates risk over a wide range of absolute 25(OH)D concentrations, a research gap noted by the IOM experts. By clarifying at what 25(OH)D concentrations an effect on colorectal cancer incidence might be observed, our results facilitate interpretation of RCTs of supplemental vitamin D. Finally, our study suggests that optimal circulating 25(OH)D concentrations for colorectal cancer risk reduction are 75–100 nmol/L, higher than current IOM recommendations for bone health. Although our results are relevant to future recommendations for optimal vitamin D status, the effects of vitamin D on health outcomes other than colorectal cancer also need to be evaluated and integrated into public health guidance.
Funding
NCI R01CA152071, R25CA098566, T32CA009001, R03CA212799, and R03CA183016; National Heart, Blood, and Lung Institute T32HL125232; National Cancer Institute Intramural Research Program.
Notes
Affiliations of authors: Behavioral and Epidemiology Research Program, American Cancer Society, Atlanta, GA (MLM, PTC, SMG); Departments of Epidemiology (ESZ, MW, NRC, AHE, JEB, ELG, IML, MJSt, WCW, SASW), Biostatistics (MW), and Nutrition (ELG, TH, MJSt, KW, SSY, WCW, SASW), Harvard T. H. Chan School of Public Health, Boston, MA; Section of Preventive Medicine and Epidemiology, Department of Medicine, Boston University School of Medicine, Boston, MA (ESZ); Division of Genetics, Department of Medicine, Brigham and Women's Hospital, Boston, MA (ESZ); Division of Cancer Epidemiology and Genetics, National Cancer Institute, National Institutes of Health, Department of Health and Human Services, Bethesda, MD (SJW, DA, NDF, WYH, MPP, MHG, RGZ); Department of Epidemiology, Rollins School of Public Health, Winship Cancer Institute, Emory University, Atlanta, GA (VF); Channing Division of Network Medicine (MW, AHE, ELG, MJSt, XZ, WCW) and Division of Preventive Medicine (NRC, JEB, IML), Department of Medicine, Brigham and Women’s Hospital and Harvard Medical School, Boston, MA; Division of Epidemiology, Department of Population Health and Perlmutter Cancer Center (AZJ) and Division of Epidemiology and Biostatistics, Department of Population Health (TVC), New York University School of Medicine, New York, NY; Epidemiology and Prevention Unit, Fondazione IRCCS Istituto Nazionale dei Tumori, Milan, Italy (CA, VK, SSi); Division of Public Health Sciences, Fred Hutchinson Cancer Research Center, Seattle, WA (MJB, GGG, MLN); Department of Preventive Medicine, Keck School of Medicine and Norris Comprehensive Cancer Center, University of Southern California, Los Angeles, CA (CAH, GU); Department of Epidemiology and Population Health, Albert Einstein College of Medicine, Bronx, NY (TERoh); Department of Occupational Medicine, Epidemiology and Prevention, Feinstein Institute for Medical Research, Hofstra Northwell School of Medicine, Great Neck, NY (GYFH); Heartland Assays, LLC, Ames, IA (RLH); Section of Nutrition and Metabolism, International Agency for Research on Cancer (IARC-WHO), Lyon, France (MJ); Division of Genetics and Epidemiology (MEJ, MJSc, AJS) and Division of Breast Cancer Research (AJS), The Institute of Cancer Research, London, UK; Department of Epidemiology, Johns Hopkins Bloomberg School of Public Health, Baltimore, MD (CEJ, EAP, KV); Department of Food and Nutrition, Seoul National University, Seoul, Korea (JEL); Department of Health National Institute for Health and Welfare, Helsinki, Finland (SM); Epidemiology Program, University of Hawaii Cancer Center, Honolulu, HI (LLM, KKW); Department of Epidemiology, University of Michigan School of Public Health, Ann Arbor, MI (AMM); Department of Epidemiology and Biostatistics, The School of Public Health, Imperial College London, London, UK (ER); Cancer Registry of Norway, Institute of Population-Based Cancer Research, Oslo, Norway (TERob, STr, GU); Epidemiology and Prevention Group, Center for Public Health Sciences, National Cancer Center, Tokyo, Japan (SSasazuki, STs); Department of Health Promotion Sciences, University of Arizona Mel and Enid Zuckerman College of Public Health, Tucson, AZ (CAT); Institute of Basic Medical Sciences, Medical Faculty, University of Oslo, Oslo, Norway (GU).
The sponsors had no role in the design, data collection, data analyses, interpretation of the results, preparation of the manuscript, or the decision to submit the manuscript for publication.
The authors have no conflicts of interest to disclose.
References
Author notes
Co-first authors
Co-senior authors

