


Abstract
Presented here is a system to standardize clinical studies of nutrient effects, using nutrient-specific physiological criteria. These guidelines are based mainly on analysis of the typical sigmoid curve of biological response to nutrients and are intended for design, interpretation, and pooling of studies of nutrient effects. Five rules have been articulated for individual studies of nutrients, and six for systematic reviews and/or meta-analyses.
Introduction
Nutrition can be an emotionally charged topic, and despite a decision over 20 years ago to base nutrient intake recommendations explicitly in evidence,1 recent releases from the Institute of Medicine (IOM) have, if anything, become even more controverted than previously.2,3 Without wishing in any way to deprecate the IOM or its recommendations, it is noted that recent reports have elicited widespread dissent within the scientific community. The vitamin D intake recommendations of the IOM,4,–14 together with the recent reversal of the sodium intake recommendation (and its associated controversy),15,16 are but two instances of such lack of consensus. It had been hoped that the shift to a more explicit evidence base would have reduced controversy. The fact that this has not happened suggests not that the broad strategy was wrong, but that the flaw may reside in the studies that constitute the evidence.
A case has been made that the current approach is excessively phenomenological and that a set of criteria based in the relevant physiology might be preferable.17 However, as there appears to be no current prospect of a consensus for such a physiology-based approach, it is likely that the field of clinical nutrition will continue to be dominated by studies assessing health outcomes (or their proxies) produced by changes in intake of nutrients, often studied one at a time and using standard clinical research designs. Given that likelihood, it would seem that articulating a set of “rules,” or “guidelines,” for the design of such studies (and for their pooling in systematic reviews) could remove some of the basis for the prevailing disagreement and misunderstanding, and perhaps lead to a more rational basis for dialogue about the relevant issues.
In this article just such a set of guidance criteria is proposed, based explicitly in the generally recognized relationship of clinical response to change in nutrient intake.18,19 One might have thought this would have been done years ago, but the application of the methods of evidence-based medicine (EBM) to nutrients (as contrasted with drugs) is a quite recent development, and, to date, the EBM guidelines, developed specifically for drugs, have been applied to nutrients without apparent attention to important differences between them. The rules set forth here are explicitly specific to nutrients and are, to the author's knowledge, the first attempt to do this; they represent a technical expansion and further explication of a discussion initially developed for the general reader and presented on the author's nutrition blog site (http://blogs.creighton.edu/heaney/).
The Nutrient Response Curve
A good place to start is with Figure 1, which has been adapted from the Dietary Reference Intakes monograph published by the IOM in 2006.1 The curve explicitly expresses risk, and hence is U-shaped with risk declining as intake increases up to what would usually be considered the adequate range; above this range, pharmacologic or toxic effects begin to manifest, and thus risk rises again (though of a different sort than the risk produced by deficiency). When, as is perhaps more appropriate for nutrients, the response is expressed in terms of net benefit rather than risk of harm, the U-shape is simply inverted, producing a curve that resembles a mesa or a gum drop, as depicted in standard textbooks of nutritional epidemiology.19 Either way, even brief inspection of the response curve makes clear that response to a change in intake will be dependent upon an individual's starting nutritional status. If the basal status is deficient, then an increase in intake will usually produce a measurable benefit (or a reduction of risk). If the nutritional status is replete, an increase in intake will usually produce a null effect, and if the nutritional status is high, an increase in intake might be expected to increase risk of toxicity (or to decrease net benefit).
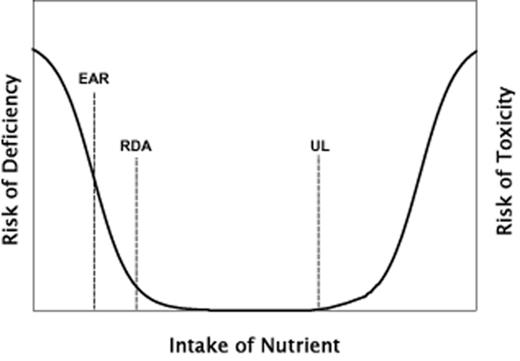
Relationship between nutrient intake and risk of harm (on the left from deficiency and on the right from toxicity). Three dietary reference intakes (EAR, estimated average requirement; RDA, recommended dietary allowance; and UL, tolerable upper level of intake) are indicated at their respective positions along the intake axis.
Adapted from Otten et al. (2006).1
This point is so obvious from simple inspection of the curve that one should have thought it would go without saying. Nevertheless, literally hundreds of studies of nutrient effects have reported null, or even adverse outcomes of nutrient interventions, almost always without reference to the basal status that prevailed in the study sample. Similarly, systematic reviews and meta-analyses have commonly pooled studies using different doses and different starting values, once again usually without reference to the relationship depicted in Figure 1. In brief, the nutrient dose-response curve and its consequences, while well recognized in some sectors of the nutrition research community, are seemingly overlooked in the design and interpretation of many, and perhaps most, clinical trials of nutrient effects.
There are certain features of the nutrient response curve, beyond its generic U- or J-shape, which deserve particular attention. As clinical nutrition studies generally focus on benefit, it is useful to concentrate on the left half of the dose-response relationship, with benefit rising with intake as a sigmoid-shaped curve, as in Figure 2. In the text that follows, the focus is exclusively on nutrient intakes within this sigmoid range (the left-sided portion of Figure 1), not on pharmacological or possibly toxic intakes (the right-sided portion of Figure 1).
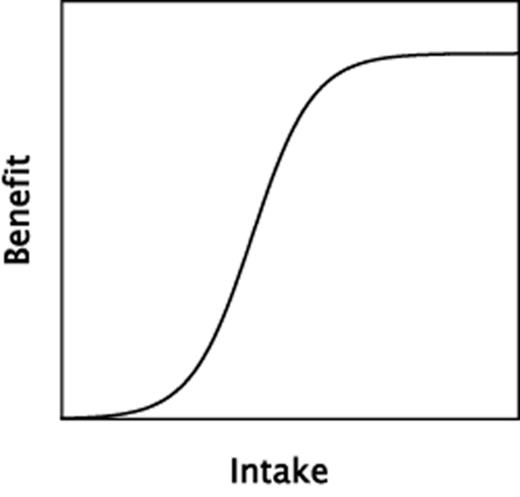
A typical, sigmoid-shaped dose-response curve relating nutrient benefit to nutrient intake within the physiological range of intakes.
The curve of Figure 2 describes most biochemical and pharmacological responses and is, in a sense, the standard model for the discipline of pharmacology. The extreme left end of the curve is often flat, i.e., increases in intake or dose produce little effect until intake reaches the ascending limb of the curve. This is analogous to pump priming in hydraulics systems. Conversely, at the right end of the curve in Figure 2, little effect is produced by yet higher intakes because the biochemical response systems have become saturated and are not capable of producing further effect when exposed to greater inputs.
For most biochemical reactions and drug effects, the sigmoid curve extends over approximately three orders of magnitude, and since human dosing of test drugs is commonly focused on the mid-region of that curve, where the line is nearly straight, clinical responses to drugs are often treated as if they had linear characteristics. With nutrients, however, the entirety of the sigmoid is typically encompassed within an intake range spanning a single order of magnitude. Examples might include calcium, where the 95% range of human intakes extends from about 200 to 2,000 mg/day, or vitamin D, where the physiological range [expressed as serum 25(OH)D] is estimated to extend from about 25 to 225 nmol/L (10 to 90 ng/mL). If changing the intake of either nutrient is to have certain physiological effects, they will be found within those comparatively narrow ranges.
A key consideration flowing from the sigmoid shape of the curve is the need to locate the intervention so that the basal status/intake is chosen so as to lie to the left of the ascending limb in Figure 2, and the change in intake is large enough to span much, or all, of the response region. This emphasis is not merely a theoretical concern. Several key studies have fallen into the trap of working mainly at either the low or the high end of the response curve. The calcium arm of the Women's Health Initiative (WHI) is one example.20 In this study, both the control and the treatment arms had calcium intakes averaging above 1,000 mg/day and, inevitably, many participants, and perhaps most, would have had intakes above their personal response zone. The designers had relied on NHANES data for population calcium intake, in which median intake for women of the target age was under 600 mg/day, a figure that could well have been low enough along the intake axis to permit detection of a response. However, in executing the trial, low calcium intake was not used as an inclusion criterion, and some combination of healthy volunteer bias and increasing calcium supplement use by the target population produced an enrolled cohort with a calcium intake approximately twice as high as had been anticipated. Something similar happened in the Calcium Preeclampsia Prevention Trial,21 though in this case an ethical issue inserted itself into the design, since it would have been problematic to hold a pregnant control group to an intake that was half of the then-recommended levels.
At the opposite (low) end of the response curve, the vitamin D intervention in the WHI study (∼200 IU/day after factoring in compliance) was, in itself, too small a dose to change vitamin D nutritional status appreciably,22 and, given the low basal status of the cohort, would have been insufficient to push their intakes into the ascending region of the response curve.
This is not to criticize the design of these studies, as the errors they contained flowed, in part, from lack of needed knowledge when the studies were planned. They are cited here principally because they illustrate, in actual studies, both the consequences of the dose-response curve for nutrients and the fact that those consequences have important effects in the real world of clinical nutrition.
As the transition from inadequate to adequate status occurs somewhere within the range of plausible intakes, studies intended to detect and quantify that effect must be centered on the intake range where the transition occurs. A clear instance of the importance of identifying the relevant response range is provided by a recent study evaluating the association between vitamin D status and insulin resistance.23 This study was performed in a large cohort with an unusually broad range of vitamin D status values, which permitted evaluation of response as a function of varying vitamin D status values. In brief, insulin resistance was found to be inversely associated with vitamin D status. However, the transition from higher to lower resistance was found to occur in the 25(OH)D range between 40 and 90 nmol/L (16 and 36 ng/mL). Outside this range, vitamin D status was unrelated to insulin resistance. Thus, approximately three-fourths of the physiological range of vitamin D status values exhibited no association with insulin resistance. It is important to understand that this does not mean that vitamin D was without effect at 25(OH)D values above 90 nmol/L (36 ng/mL). Rather, no additional lowering of resistance could be produced by further increases in vitamin D status above that level. So, studies performed entirely within that intake range would (as with the WHI calcium arm) have found no effect.
This compression of the sigmoid curve into a single order of magnitude means also that the response to a change in intake, for many, and perhaps most, nutrients, cannot safely be treated as if it were linear. Reports frequently conclude that the outcome differs by a certain amount for each unit increase in nutrient intake. To be accurate, that statement must assume a continuous (usually linear) relationship which, over the physiological range of nutrient status values, will often be untenable. As a consequence, the common mode of reporting associations between nutrient intakes (or status) and certain outcomes has to be recognized as inadequate.
Study Design Guidance
Given the reality of the response curves depicted in Figures nure12090-fig-0001 and nure12090-fig-0002, it seems useful to suggest several rules that should be kept in mind when designing (or interpreting) studies to evaluate specific nutrient effects (listed in Box 1). It may be worth noting that, in animal studies of nutrient effects, these rules would almost invariably be followed: basal status, dose, and conutrient status would all be controlled or standardized. It is harder to do that in human studies, but is no less important. Rules 1–3 follow directly from the nutrient response curve and have already been discussed. Rules 4 and 5, however, may require some elaboration.
Basal nutrient status must be measured, used as an inclusion criterion for entry into study, and recorded in the report of the trial.
The intervention (i.e., change in nutrient exposure or intake) must be large enough to change nutrient status and must be quantified by suitable analyses.
The change in nutrient status produced in those enrolled in the trials must be measured and recorded in the report of the trial.
The hypothesis to be tested must be that a change in nutrient status (not just a change in diet) produces the sought-for effect.
Conutrient status must be optimized in order to ensure that the test nutrient is the only nutrition-related, limiting factor in the response.
As the underlying hypothesis for most nutrients will commonly be that a change in nutrient status produces a certain effect, the analytical focus needs to be not on the intervention but on the actual, i.e., measured, change in status which it produced. Of course, meticulous attention to the dietary intervention remains necessary. However, if the analytical focus is on what the investigator sees (the intervention), rather than on what the study participants experience (change in status), there will inevitably be a need to take into consideration problems of adherence, varying absorption, intrinsic biological differences in responsiveness, and the like. These considerations are clearly important and will usually be applicable in the evaluation of drugs, but they are not necessary in the discernment of nutrient effects (as contrasted with nutrient requirements). This is the reason for emphasizing both the focus on change in status as the independent variable, and the measurement (and documentation) of that change (Rule 3).
Rule 5 highlights another distinction between nutrients and drugs. In the case of the latter, emphasis is usually placed on removing concomitant therapies insofar as possible, both to reduce differences among participants and to focus primarily on the effect of the drug being evaluated. But, as is generally recognized, nutrients are different. They interact with one another and the ability of an organism to respond to one is often dependent upon the status of several others. Calcium effects usually need vitamin D for their expression.24 Sodium effects are influenced by calcium and potassium intake.25 Bone gain in response to calcium and vitamin D supplementation is dependent upon protein intake status.26,27 Parathyroid hormone response to vitamin D depends upon magnesium status.28 The list can continue. Thus, to study the effect of improving the status of a particular nutrient, it is important that the nutritional status of the participants with respect to all related nutrients be optimized, thereby permitting an evaluation of whether changing the status of a test nutrient makes any difference.
It is puzzling and, indeed, surprising how often this rule is ignored or overlooked. It may be that its importance and salience are simply not understood. Figure 3 provides a graphic illustration of nutrient-nutrient interaction with respect to its effect on measurable clinical outcomes. In each panel, the far-left bar, labeled Ω, is the outcome variable, with the top of the bar reflecting optimal status, while the shaded portion is actual status. Similarly, the three bars to the right in each panel stand for three nutrients (X, Y, and Z) hypothesized to affect outcome Ω. The shaded portion represents actual intake/status, and the top of the bars represent fully adequate intakes. Although the diagram is generic, it could easily represent, for example, bone mineral density or fracture incidence as the outcome variable (Ω), and nutrients X, Y, and Z might be calcium, vitamin D, and protein, respectively. Panel A represents the basal status, panels B, C, and D represent what might happen in a study completely optimizing intake of the respective nutrients.
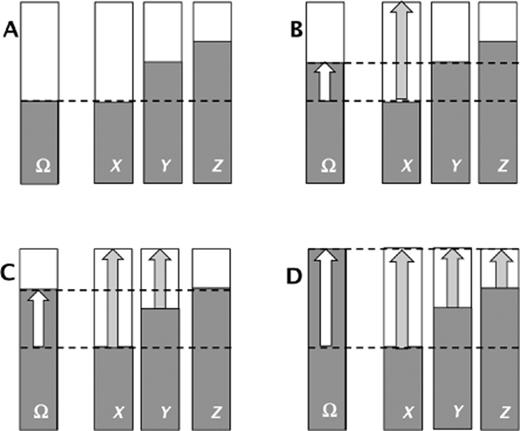
Schematic illustration of response to supplementation in the common situation in which multiple nutrients are consumed in inadequate quantities. Panel A describes the unsupplemented (basal) status, and panels B, C, and D describe response to supplementation with nutrients X, X + Y, and X + Y + Z, respectively.
In Panel B (illustrating repletion with nutrient X), note that, while the outcome variable improves, that improvement stops at the point where nutrient Y is now limiting. And if both nutrient X and nutrient Y intakes are completely optimized (Panel C), improvement in outcome Ω is blunted at the point at which nutrient Z becomes the limiting variable. Only when intakes of all three nutrients are rendered adequate (Panel D) can the outcome variable be optimized. And, as is often the case, if the primary focus is on nutrient X, it is clear that its effect will be missed (or at least underestimated) unless intake of nutrients Y and Z are fully adequate. Note also that, while intake of nutrient Y is inadequate, response to supplementation with Y will likely be null, as the more extreme inadequacy of nutrient X would prevent response to supplementation with nutrient Y.
As is apparent, these five rules imply knowledge of the general shape of the response curve for the nutrient being investigated. Often, this information is not available or is known only in a very general way. One consequence is that investigators may recruit a sample with a basal status that is in the wrong region of the curve, through no fault of their own. The outcome of such studies, which could well be null, should be described not as “nutrient X had no effect on system Y,” but, instead as, “change in status of nutrient X from level A to level B had no effect on outcome Y.” Very few of the null studies that are commonly reported with respect to various nutrient effects exhibit that sort of nuance. Instead, they typically state simply “nutrient X was without effect on system Y,” often with a finality suggesting that the case is closed.
An additional consequence of the response curve is that, even if the same increment in intake is used in all participants, basal values that vary from individual to individual will inevitably result in different responses. Thus, averaging results across an intervention group will often blur, if not totally obscure, an underlying real effect.18 This is why basal status needs to be standardized (Rule 1) both within a given study and when pooling studies. Similarly, the nonlinear nature of the curve means that twice the dose will not produce twice the response, particularly if, as in the case of vitamin D cited above, the transition occurs in a narrow portion of the nutrient status continuum. This is a particularly critical issue when pooling studies in systematic reviews and meta-analyses, since it is not possible to adjust for dose unless one knows both the precise character of the response curve and the location of the sampling units in different studies relative to the effect transition.
These considerations lead, then, to a second set of guidance criteria listed in Box 2, which is for the pooling of studies in systematic reviews and meta-analyses, now usually done primarily using methodologic rather than biologic criteria. As with the rules offered for individual studies, most of the rules in Box 2 flow more or less directly from the sigmoid character of the response curve. Basically, they boil down to “pool like with like.” In other words, do not pool together studies that used different doses or forms of a nutrient, or which supplied the nutrient in different food matrices, or which were performed in populations with different basal status values, or which had differing nutritional status values for the relevant nutritional covariates, or which had markedly different periods of exposure to the altered intake. Rule 5 is not followed in any systematic review or meta-analysis known to the author at the time of manuscript preparation. For example, two papers from the Cochrane group, one on the skeletal effects of vitamin D29 and one on the skeletal effects of calcium,30 specifically rejected any study using calcium or vitamin D, respectively. And as recently as 2013, a meta-analysis of vitamin D confined its focus to studies using vitamin D alone.31 Finally, the need for attention to treatment duration [Rule 6] exists because nutrient responses can be nonlinear, not only with respect to intake, but also with respect to the period of observation.32
The individual studies selected for review or meta-analysis must themselves have met the criteria listed in Box 1 for nutrient trials.
All included studies must have started from the same or similar basal nutrient status values.
All included studies must use the same or closely similar doses.
All included studies must have used the same chemical form of the nutrient and, if foods are used as the vehicle for the test nutrient, all studies must have employed the same food matrix.
All included studies must have the same conutrient status.
All included studies must have had approximately equal periods of exposure to the altered intake.
Systematic reviews of nutrients that disregard one or more of these rules are legion. The primarily methodologic criteria commonly used for the inclusion of studies into such reviews are simply not adequate to ensure the needed biological comparability across pooled studies.
Conclusion
These guidelines are not the first or the only effort aimed at refining the evidence-based analysis approach to nutrient effects. For example, Achterberg33 recently expanded the 7-step process of the American Dietetic Association (now the Academy of Nutrition and Dietetics), adding three new steps, for a total of 10. Her step 3, “Formulate the problem as a research question (e.g., What is the effect of carbohydrate intake on weight in healthy adult Americans?)” is the only one of the 10 that focuses on biological features of the nutrient context. The five guidelines set forth in Box 1 are effectively an expansion of her step 3.
It is important to acknowledge that, while the rules listed in Box 2 for systematic reviews may seem draconian, they will usually be necessary to deal with the issue of biological heterogeneity. In theory, analytic strategies could be devised in systematic reviews to factor in differences in basal values, dose sizes, and status of conutrients, but this is virtually never done. In the evaluation of the prevailing literature preparatory to publishing the study of vitamin D and insulin responsiveness cited earlier,24 every reported study, with the exception of two split-plot analyses, had treated the tested relationship as linear across the full range of plausible intake values, an approach which this article shows will often be inadequate.
In any case, failure to observe these sets of rules, either in individual studies or in systematic reviews and meta-analyses, will inevitably bias the results toward the null. It may be objected that these rules are an ideal, that we may not have the knowledge needed to apply them, even if we had the will. That much is certainly true. Moreover, it is worth noting that, important as it may be, quantifying change in nutrient status (Rules 3 and 4 in Box 1) can itself be daunting. For a nutrient such as vitamin D, the task is easy, as the IOM defined serum 25(OH)D as the functional indicator of vitamin D status.34 While serum 25(OH)D is not a perfect indicator, it directly measures blood concentration of a key vitamin D metabolite and is a widely used and accepted indicator. For other nutrients, particularly those for which blood concentration is regulated by the organism (and for which blood concentration would not be useful), a physiologically based approach may be available. For many such nutrients, “optimal” may be operationally defined as the intake that minimizes the organism's need to compensate for departures from an intake setpoint around which the system operates. Examples would be PTH for calcium intake and renin or aldosterone for sodium intake, among others. For more difficult nutrients, such as magnesium, there are tools such as the magnesium-tolerance test. However, it is worth noting that these are all measures of change in nutrient status, not outcomes of the induced change. Outcome measures present their own array of challenges.
Nutrients are a heterogeneous lot. Not all the suggested rules have equal force for all nutrients. It may be, for example, that conutrient status is less important for nutrient A than it is for nutrient B. Nevertheless, each rule reflects features that investigators need to consider and factor into their design and analysis. Additionally, the rules serve several purposes beyond study design: 1) They allow us to understand why studies of actually efficacious agents might turn out to be null, especially if the rules had not been (or could not have been) followed. 2) In the case of systematic reviews and meta-analyses, the rules should stop us from continuing to cite studies as evidence of a certain conclusion when, in hindsight, we ought to have recognized that these studies could not validly have tested the associated hypotheses. That mistake was a conspicuous feature of the systematic reviews35 relied upon by the IOM and the U.S. Preventive Services Task Force in formulating their recent policy statements3,36 for calcium and vitamin D. 3) Inability to apply these rules in a particular systematic review must be acknowledged as a weakness (however unavoidable it may be) and, accordingly, the findings of such reviews must be acknowledged as tentative. 4) The rules help shape a research agenda, as they identify what it is we need to know in order to mount truly informative clinical trials of nutrient effects.
Funding
This work was supported by Creighton University research funds.
Declaration of interest
The authors have no relevant interests to declare.
References
