


Abstract
Population studies provide evidence that obesity and insulin resistance are associated not only with elevated serum insulin levels and reduced serum adiponectin levels but also with increased risk of aggressive prostate and colon cancer. We show here that adiponectin activates AMP-activated protein kinase (AMPK) in colon (HT-29) and prostate (PC-3) cancer cells. These results are consistent with prior observations in myocytes, but we show that in epithelial cancer cells AMPK activation is associated with reduction in mammalian target of rapamycin activation as estimated by Ser2448 phosphorylation, with reduction in p70S6 kinase activation as estimated by Thr389 phosphorylation, with ribosomal protein S6 activation as estimated by Ser235/236 phosphorylation, with reduction in protein translation as estimated by [35S]methionine incorporation, and with growth inhibition. Adiponectin-induced growth inhibition is significantly attenuated when AMPK level is reduced using small interfering RNA, indicating that AMPK is involved in mediating the antiproliferative action of this adipokine. Thus, adiponectin has the characteristics of a AMPK-dependent growth inhibitor that is deficient in obesity, and this may contribute to the adverse effects of obesity on neoplastic disease. Furthermore, metformin was observed to activate AMPK and to have growth inhibitory actions on prostate and colon cancer cells, suggesting that this compound may be of particular value in attenuating the adverse effects of obesity on neoplasia.
AMP-activated protein kinase (AMPK) is a heterotrimeric complex consisting of a catalytic subunit and two regulatory subunits encoded by three genes, each of which has at least two isoforms (1). AMPK is a key regulator of the cellular response to energy stress (2, 3). AMPK activation requires phosphorylation by an activating protein kinase (4). Recently, LKB1 serine/threonine kinase (a tumor suppressor whose inactivation leads to Peutz-Jeghers syndrome) has been identified as a kinase that activates AMPK (5). AMPK activation inhibits mammalian target of rapamycin (mTOR) and its downstream effector kinases (6). AMPK activation stimulates downstream signaling pathways that lead to decreased energy utilization (3, 4).
AMPK is activated in muscle via a poorly understood mechanism by the adipokine adiponectin (7, 8). Although adiponectin is produced by adipocytes, circulating levels of this adipokine, paradoxically, are inversely correlated with body mass index (9). The role of AMPK in meditating the metabolic effect of adiponectin on fatty acid oxidation in liver has been documented (8).
There is clear evidence that obesity is associated with increased cancer mortality (10), and there is interest in the metabolic mediators of this association. Candidate mediators include the elevated level of insulin and reduced level of adiponectin found in obese as compared with normal-weight individuals. A recent study provides early evidence that high adiponectin levels are associated with reduced prostate cancer risk (11).
Metformin, a biguanide used in the treatment of type II diabetes, inhibits gluconeogenesis by a mechanism involving activation of AMPK in liver. This reduces hepatic glucose output and circulating glucose levels, which leads to a decline in circulating insulin levels (12). We recently showed (13) that in breast cancer cells, metformin also activates AMPK in a manner that results in inhibition of S6 kinase (S6K) activation and n growth inhibition. Thus, there are at least two possible mechanisms underlying the antiproliferative effect of metformin on neoplastic cells in vivo: reduction of systemic insulin levels, which may reduce insulin-stimulated cancer cell growth (14, 15), and a direct action involving AMPK activation within neoplastic cells (13). However, recent evidence for possible further mechanisms involving p53 (16) on cyclin D1 (17) has also been presented.
The potential chemical relevance of the antiproliferative actions of metformin is shown by recent pilot studies carried out using population registries. These provide early evidence that metformin use may reduce cancer risk and/or improve cancer prognosis (18, 19).
Here, we report that both metformin and adiponectin act as growth inhibitors of colon and prostate cancer cells by a mechanism involving AMPK activation.
Materials and Methods
Chemicals
Cell culture materials were obtained from Invitrogen. Anti–phospho-specific (Thr172) AMPKα, anti-AMPKα, anti–phospho-p70S6K (S6K1; Thr389), anti–phospho-mTOR (Ser2448), anti-mTOR, anti–phospho-specific ribosomal protein S6 (S6K2; Ser235/236), and anti–β-actin were purchased from Cell Signaling Technology. Horseradish peroxidase–conjugated antirabbit IgG, antimouse IgG, and enhanced chemiluminescence reagents were from Pharmacia-Amersham. Metformin (1,1-dimethylbiguanide hydrochloride) was obtained from Sigma-Aldrich. Adiponectin (globular protein) was purchased from Phoenix Pharmaceuticals, Inc. Small interfering RNA (siRNA)-AMPKα1 and negative control siRNA (Alexa Fluor 488) were purchased from Qiagen.
Cell lines and culture conditions
Cell lines were purchased from American Type Culture Collection. Cells were cultured in RPM1 1640 (PC-3 and HT-29) or DMEM (HeLa), supplemented with 10% fetal bovine serum (FBS) and 100 units/mL genetamycin, at 37°C and 5% CO2. Cells were passaged with 0.25% trypsin-EDTA when they reached ∼80% confluence.
Cell proliferation assay
The effect of adiponectin and metformin on the cell lines was evaluated with the indicator dye Alamar Blue (Biosource International). Cells were plated at 3 × 10³ to 5 × 10³ per well in triplicate in 96-well plates and incubated in medium containing 10% FBS. After 24 h, the complete medium was replaced with test medium containing vehicle control or various doses of metformin and adiponectin for 72 h at 37°C. Alamar Blue was then added and all plates were incubated at 37°C, and a colorimetric change was measured according to the methods provided by the supplier.
Protein extraction and Western blot analysis
Cells were washed thrice with ice-cold PBS and lysed in 100 to 400 μL of lysis buffer (20 mmol/L Tris-HCl, pH 7.5), 150 mmol/L NaCl, 2.5 mmol/L sodium pyrophosphate, 1 mmol/L β-glycerol phosphate, 1 mmol/L Na3VO4, 1 mmol/L EGTA, 1% Triton, and complete protease inhibitor mixture inhibitors from Roche Diagnostic. Cells debris was removed by centrifugation at 14,000 × g for 20 min at 4°C. Following assay for total protein (Bio-Rad), clarified protein lysates from each experimental condition (40-50 μg) were boiled for 5 min and subjected to electrophoresis in denaturing 8% SDS-polyacrylamide gel for mTOR or 10% SDS-PAGE for other proteins. Separated proteins were transferred onto a nitrocellulose membrane and, after blocking, the membranes were probed with antibodies of interest. Horseradish peroxidase–conjugated antirabbit IgG and antimouse IgG were used as secondary antibodies. The position of proteins was visualized with enhanced chemiluminescence reagent.
Cell transfection
HT-29 and PC-3 cells were transfected with siRNA targeting AMPKα1 or a negative control siRNA using a pipette-type electroporator (MicroPorator MP-100, Digital Bio Technology Co., Ltd.) according to the manufacturer's instructions. Cells cultures were incubated for 24 h with various concentrations of siRNA before metformin treatment.
[35S]Methionine metabolic labeling
For experiments with adiponectin, PC3, HT-29, and HeLa S3 cells were seeded in 24-well plates (30,000 per well) and incubated with increasing doses of adiponectin (0-2,000 ng/mL) for 72 h in RPMI (DMEM for HeLa S3) supplemented with 1% FBS. After 72 h, cells were washed once with PBS and incubated with methionine-free DMEM containing 35S-protein labeling mix (20 μCi/mL). After 30 min, the cells were washed with cold PBS; lysed in buffer containing 1% Triton, 150 mmol/L NaCl, 20 mmol/L Tris-HCl (pH 7.5), and 1 mmol/L EGTA; and radioactivity incorporated into trichloroacetic acid (5%)–precipitable material was measured.
For experiments with metformin, PC3 and HT-29 cells were seeded in 24-well plates (80,000 per well) and incubated with 0 or 10 mmol/L metformin for 24 h in serum-free RPMI. HeLa S3 cells were incubated with 0 or 10 mmol/L metformin for 24 h in DMEM supplemented with 10% FBS. After 24 h, cells were washed once with PBS and incubated with methionine-free DMEM containing 35S-protein labeling mix (20 μCi/mL) and 10% dialyzed FBS. HeLa S3 cells were labeled in methionine-free medium without FBS. After 30 min, cells were washed with cold PBS and lysates were prepared and measured for incorporation of [35S]methionine as described above.
Statistical analysis
Before statistical analysis, data were square-root transformed to satisfy the assumptions of analysis. Statistical significance was evaluated using a general linear model procedure, and least-squares means post hoc for multiple non-pairwise comparisons of means (LSMEANS statement with Bonferroni correction) was applied. All statistical analyses were done using Statistical Analysis System software, version 9.1.3 (SAS Institute). P < 0.05 was considered significant.
Results
Adiponectin and metformin are growth inhibitors for PC-3 and HT-29 cells
Dose-response studies with adiponectin showed dose-dependent growth inhibition of both PC-3 prostate cancer cells and HT-29 colon cancer cells (Fig. 1). Metformin was also growth inhibitory for these cell lines, consistent with our prior observation for breast cancer cells (13). Interestingly, HeLa cells, which are LKB1−/− (5), were not growth inhibited by either adiponectin or metformin (Fig. 1).
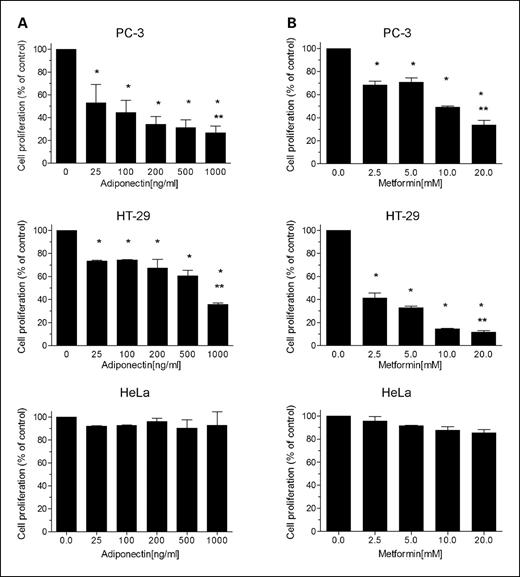
Effects of adiponectin (A) and metformin (B) on the proliferation of cancer cells. Growth inhibition of PC-3 (prostate) and HT-29 (colon) cancer cells by adiponectin and metformin was observed. HeLa cells, which have no functional LKB1 allele (5), were not inhibited. Cells (5,000 per well) were seeded into 96-well plates in the presence of 1% FBS and, after 24 h, exposed to the indicated concentrations of adiponectin. Cell proliferation in each well was measured by Alamar Blue dye reduction. Columns, mean from three independent experiments done in triplicate; bars, SE. *, P < 0.001, significantly different result from that obtained in the absence of adiponectin or metformin (ANOVA). **, P < 0.0001, significant difference between control and highest dose for each cell line (multiple non-pairwise comparison post hoc).
Effects of adiponectin (A) and metformin (B) on the proliferation of cancer cells. Growth inhibition of PC-3 (prostate) and HT-29 (colon) cancer cells by adiponectin and metformin was observed. HeLa cells, which have no functional LKB1 allele (5), were not inhibited. Cells (5,000 per well) were seeded into 96-well plates in the presence of 1% FBS and, after 24 h, exposed to the indicated concentrations of adiponectin. Cell proliferation in each well was measured by Alamar Blue dye reduction. Columns, mean from three independent experiments done in triplicate; bars, SE. *, P < 0.001, significantly different result from that obtained in the absence of adiponectin or metformin (ANOVA). **, P < 0.0001, significant difference between control and highest dose for each cell line (multiple non-pairwise comparison post hoc).
Adiponectin and metformin increase phospho-AMPKα (Thr172) levels and decrease phospho-S6K (Ser235/236) levels in both PC-3 and HT-29 cells
The metabolic action of adiponectin on its classic targets (skeletal muscle and adipose tissue) has been described (7, 9), but the consequences of adiponectin interaction with transformed epithelial cells are less well characterized. Data in Fig. 2 show that adiponectin exposure increases phospho-AMPKα (Thr172) levels in both PC-3 prostate cancer cells and HT-29 colon cancer cells. As expected, the increase in AMPK activation is associated with a suppression of S6K activation at Ser235/236. Metformin also activates AMPK and reduces levels of phospho-S6K (Ser235/236) in prostate and colon cancer cells, consistent with our prior report of metformin action in breast cancer cells (13).

Adiponectin and metformin up-regulate AMPK activity in HT-29 (colon cancer) and PC-3 (prostate cancer) cells. Cells were exposed to the indicated concentrations of adiponectin (A) or metformin (B) for 72 h. After harvesting, cells were lysed and prepared for immunoblot analyses with antibodies against phospho-AMPK (Thr172), phosphorylated p70S6K (Thr389), or phosphorylated S6K (Ser235/236). β-Actin is shown as a loading control. Relative levels of phosphorylated AMPK, p70S6K, and S6K were quantified by scanning densitometry and normalized by β-actin. In each case, the level at the highest concentration of adiponectin or metformin was significantly different from the level under control conditions (P < 0.0001, ANOVA).
Adiponectin and metformin up-regulate AMPK activity in HT-29 (colon cancer) and PC-3 (prostate cancer) cells. Cells were exposed to the indicated concentrations of adiponectin (A) or metformin (B) for 72 h. After harvesting, cells were lysed and prepared for immunoblot analyses with antibodies against phospho-AMPK (Thr172), phosphorylated p70S6K (Thr389), or phosphorylated S6K (Ser235/236). β-Actin is shown as a loading control. Relative levels of phosphorylated AMPK, p70S6K, and S6K were quantified by scanning densitometry and normalized by β-actin. In each case, the level at the highest concentration of adiponectin or metformin was significantly different from the level under control conditions (P < 0.0001, ANOVA).
siRNA against AMPK (α1 subunit) rescues cells from the inhibitory effects of adiponectin and metformin
To determine if AMPK is functionally involved in mediating the growth inhibitory action of adiponectin and metformin in PC-3 and HT-29 cancer cells, we used siRNA targeting AMPKα1 to attenuate AMPK expression and reduce the elevation in phospho-AMPK levels associated with these compounds. As shown in Figs. 3 and 4, siRNA treatment substantially rescued cells from the growth inhibitory influences of adiponectin and metformin. These data support the hypothesis that AMPK activation plays a role in the observed growth inhibition, but it remains possible that additional signaling pathways are also involved.
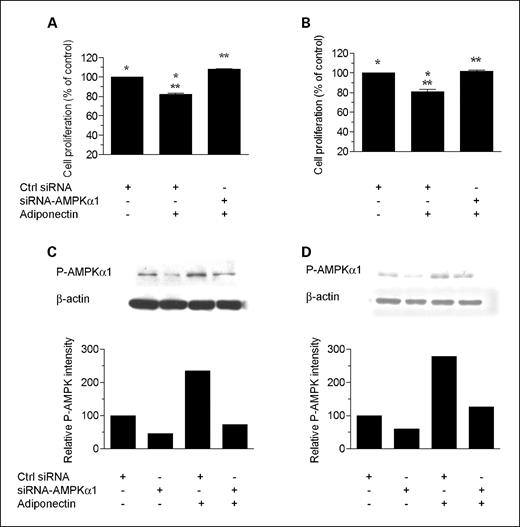
AMPKα1 siRNA reduces phospho-AMPK levels and rescues cells from the inhibitory effect of adiponectin. Cell proliferation: HT-29 (A) and PC-3 (B) cells were transfected with 50 nmol/L AMPKα1-siRNA or with control siRNA (using MicroPorator MP-100). Twenty-four hours after transfection, cells were treated with adiponectin (500 ng/mL) for 72 h. Cell proliferation in each well was measured by Alamar Blue dye reduction. Columns, mean of two independent experiments carried out in triplicate (n = 6); bars, SE. *, significant difference between control and control plus adiponectin for both HT-29 (P = 0.0017) and PC-3 (P = 0.0077) cells. **, significant difference between siRNA-AMPK and siRNA-AMPK plus adiponectin for both HT-29 (P = 0.0006) and PC-3 (P = 0.0058) cells. Results are shown as the percentage of cell proliferation relative to control. Immunoblotting: HT-29 (C) and PC-3 (D) cells were transfected with 50 nmol/L AMPKα1-siRNA or with control siRNA; 24 h after transfection, adiponectin (500 ng/mL) was added and cells were incubated for 72 h. Cells were lysed and prepared for immunoblot analysis with antibodies against phospho-AMPK (Thr172). β-Actin is shown as a loading control.
AMPKα1 siRNA reduces phospho-AMPK levels and rescues cells from the inhibitory effect of adiponectin. Cell proliferation: HT-29 (A) and PC-3 (B) cells were transfected with 50 nmol/L AMPKα1-siRNA or with control siRNA (using MicroPorator MP-100). Twenty-four hours after transfection, cells were treated with adiponectin (500 ng/mL) for 72 h. Cell proliferation in each well was measured by Alamar Blue dye reduction. Columns, mean of two independent experiments carried out in triplicate (n = 6); bars, SE. *, significant difference between control and control plus adiponectin for both HT-29 (P = 0.0017) and PC-3 (P = 0.0077) cells. **, significant difference between siRNA-AMPK and siRNA-AMPK plus adiponectin for both HT-29 (P = 0.0006) and PC-3 (P = 0.0058) cells. Results are shown as the percentage of cell proliferation relative to control. Immunoblotting: HT-29 (C) and PC-3 (D) cells were transfected with 50 nmol/L AMPKα1-siRNA or with control siRNA; 24 h after transfection, adiponectin (500 ng/mL) was added and cells were incubated for 72 h. Cells were lysed and prepared for immunoblot analysis with antibodies against phospho-AMPK (Thr172). β-Actin is shown as a loading control.

AMPKα1 siRNA reduces phospho-AMPK levels and rescues cells from the inhibitory effect of metformin. Cell proliferation: HT-29 (A) and PC-3 (B) cells were transfected with 50 nmol/L AMPKα1-siRNA or with control siRNA (using MicroPorator MP-100). Twenty-four hours after transfection, cells were treated with metformin (5 mmol/L) for 72 h. Cell proliferation in each well was measured by Alamar Blue dye reduction. Columns, mean of two independent experiments carried out in triplicate (n = 6); bars, SE. *, significant difference between control and control plus metformin for both HT-29 (P = 0.0051) and PC-3 (P = 0.0003) cells. **, significant difference between siRNA-AMPK and siRNA-AMPK plus metformin for both HT-29 (P = 0.0012) and PC-3 (P = 0.0042) cells. Results were shown as the percentage of cell proliferation relative to control. Immunoblotting: HT-29 (C) and PC-3 (D) cells were transfected with 50 nmol/L AMPKα1-siRNA or with control siRNA; 24 h after transfection, metformin (5 mmol/L) was added and cells were incubated for 72 h. Cells were lysed and prepared for immunoblot analyses with antibodies against phospho-AMPK (Thr172). β-Actin is shown as a loading control.
AMPKα1 siRNA reduces phospho-AMPK levels and rescues cells from the inhibitory effect of metformin. Cell proliferation: HT-29 (A) and PC-3 (B) cells were transfected with 50 nmol/L AMPKα1-siRNA or with control siRNA (using MicroPorator MP-100). Twenty-four hours after transfection, cells were treated with metformin (5 mmol/L) for 72 h. Cell proliferation in each well was measured by Alamar Blue dye reduction. Columns, mean of two independent experiments carried out in triplicate (n = 6); bars, SE. *, significant difference between control and control plus metformin for both HT-29 (P = 0.0051) and PC-3 (P = 0.0003) cells. **, significant difference between siRNA-AMPK and siRNA-AMPK plus metformin for both HT-29 (P = 0.0012) and PC-3 (P = 0.0042) cells. Results were shown as the percentage of cell proliferation relative to control. Immunoblotting: HT-29 (C) and PC-3 (D) cells were transfected with 50 nmol/L AMPKα1-siRNA or with control siRNA; 24 h after transfection, metformin (5 mmol/L) was added and cells were incubated for 72 h. Cells were lysed and prepared for immunoblot analyses with antibodies against phospho-AMPK (Thr172). β-Actin is shown as a loading control.
Effect of adiponectin and metformin on mRNA translation
In view of the effect of adiponectin and metformin on mTOR and S6K activation, we hypothesized that general protein synthesis would be decreased by both compounds in epithelial cells. Data in Fig. 5 support this hypothesis by showing a general decline in protein synthesis on exposure to growth inhibitory concentrations of adiponectin and metformin in HT-29 and PC-3 cells but not in LKB1−/− HeLa cells.
![Fig. 5. Inhibition of protein synthesis by adiponectin. A, HeLa, HT-29, and PC-3 cells were incubated with the indicated doses of adiponectin for 72 h and [35S]methionine-protein labeling mix (20 μCi/mL) was added to the cells for 30 min. Cells were harvested after labeling, and radioactivity incorporated into trichloroacetic acid–precipitable material was measured. Protein synthesis levels are displayed as a percentage of that exhibited in the absence of adiponectin. Columns, mean from three metabolic labeling independent experiments; bars, SE. *, P = 0.0001; **, P = 0.0024, significant difference between the control and adiponectin-treated cells. B, HeLa, HT-29, and PC-3 cells were incubated with the indicated doses of metformin for 24 h and [35S]methionine-protein labeling mix (20 μCi/mL) was added to the cells for 30 min. Cells were harvested after labeling, and radioactivity incorporated into trichloroacetic acid–precipitable material was measured. Protein synthesis levels are displayed as a percentage of that exhibited in the absence of metformin. Columns, mean from three metabolic labeling independent experiments; bars, SE. *, P = 0.0001; **, P < 0.0001, significant difference between the control and metformin-treated cells.](https://aacr.silverchair-cdn.com/aacr/content_public/journal/cancerpreventionresearch/1/5/10.1158_1940-6207.capr-08-0081/2/m_369fig05g.jpeg?Expires=1716630997&Signature=J5osUp9Ecl8pCn~KxMcYbWVJGty4ecDNKzEMNIrJrZCQDHP5dnpu1m1utb3a7RbUGMqBtbGC9FZW-dEpY8ZbfQm8wIyPSVoE2Lsj1zVxrwryI7XxOsibYqBHRhCOHJNk5ykbPBAe6b8wLSvSujK17k3RL7xoT3yvhnL9ikycV6z50ULiOlebLhJ9DFeg70SBSQ7sQRRA13HtnaDK660ypvAStCvVXXHCz-T2n0wR-KrybnNxul5CD~McQrfHLVWZ5aHPZU1Y4QPsWZ-KWCSeP9geWadnk2uTgew4emgwVS~hrd71i5I6kcmSdAhhhOSnZq4a5MhHCeDZ69eSBWLXxg__&Key-Pair-Id=APKAIE5G5CRDK6RD3PGA)
Inhibition of protein synthesis by adiponectin. A, HeLa, HT-29, and PC-3 cells were incubated with the indicated doses of adiponectin for 72 h and [35S]methionine-protein labeling mix (20 μCi/mL) was added to the cells for 30 min. Cells were harvested after labeling, and radioactivity incorporated into trichloroacetic acid–precipitable material was measured. Protein synthesis levels are displayed as a percentage of that exhibited in the absence of adiponectin. Columns, mean from three metabolic labeling independent experiments; bars, SE. *, P = 0.0001; **, P = 0.0024, significant difference between the control and adiponectin-treated cells. B, HeLa, HT-29, and PC-3 cells were incubated with the indicated doses of metformin for 24 h and [35S]methionine-protein labeling mix (20 μCi/mL) was added to the cells for 30 min. Cells were harvested after labeling, and radioactivity incorporated into trichloroacetic acid–precipitable material was measured. Protein synthesis levels are displayed as a percentage of that exhibited in the absence of metformin. Columns, mean from three metabolic labeling independent experiments; bars, SE. *, P = 0.0001; **, P < 0.0001, significant difference between the control and metformin-treated cells.
Inhibition of protein synthesis by adiponectin. A, HeLa, HT-29, and PC-3 cells were incubated with the indicated doses of adiponectin for 72 h and [35S]methionine-protein labeling mix (20 μCi/mL) was added to the cells for 30 min. Cells were harvested after labeling, and radioactivity incorporated into trichloroacetic acid–precipitable material was measured. Protein synthesis levels are displayed as a percentage of that exhibited in the absence of adiponectin. Columns, mean from three metabolic labeling independent experiments; bars, SE. *, P = 0.0001; **, P = 0.0024, significant difference between the control and adiponectin-treated cells. B, HeLa, HT-29, and PC-3 cells were incubated with the indicated doses of metformin for 24 h and [35S]methionine-protein labeling mix (20 μCi/mL) was added to the cells for 30 min. Cells were harvested after labeling, and radioactivity incorporated into trichloroacetic acid–precipitable material was measured. Protein synthesis levels are displayed as a percentage of that exhibited in the absence of metformin. Columns, mean from three metabolic labeling independent experiments; bars, SE. *, P = 0.0001; **, P < 0.0001, significant difference between the control and metformin-treated cells.
Discussion
There is evidence that the metabolic profile associated with obesity, which includes increased insulin levels (20) and decreased adiponectin levels (21), as well as other derangements, is associated with increased cancer risk and/or worsened cancer prognosis (10, 22).
Whereas hyperinsulinemia is a candidate mediator of this association (23), the results reported here are consistent with the hypothesis that the low level of adiponectin in obese subjects may also play a role. Whereas the actions of adiponectin in muscle and adipose tissue have received attention, we show here that adiponectin at physiologically relevant concentrations (adiponectin concentration in human plasma ranges from 0.1 to 30 μg/mL; ref. 8, 24) acts as a growth inhibitor for prostate and colon cancer cells through a mechanism involving AMPK activation and inhibition of signaling at S6K, which is associated with reduced protein synthesis as estimated by [35S]methionine metabolic labeling. Thus, the low levels of adiponectin associated with obesity may lead to a reduction of inhibitory influence and to more aggressive neoplastic proliferation. If in certain cancer cells normal adiponectin levels contribute to baseline AMPK activation and thus constrain mTOR activation, the low adiponectin levels associated with obesity may be associated with higher levels of mTOR signaling and downstream events that contribute to the malignant phenotype (25).
It has been shown (12) that the stimulatory effect of metformin on AMPK in the liver is dependent on LKB1, and we previously noted that the direct growth inhibitory effect of metformin on cancer cells is not seen in HeLa cells, which are LKB1 negative (13). Our observation that HeLa cells are also resistant to adiponectin-induced growth inhibition is consistent with the possibility that, like metformin, growth inhibition by adiponectin requires both LKB1 and AMPK to be functional.
In contrast to our observations, a recent study reported unexpected activation of mTOR and S6K in prostate cancer cells exposed to adiponectin (26). The difference in results may be related to important differences in experimental conditions: We used adiponectin at physiologic concentrations, whereas the other study used short exposures of much higher concentrations. Our observations are consistent with the expected consequences of AMPK activation, whereas the mechanism underlying the activation of mTOR observed by others remains unclear (26). Furthermore, we observed growth inhibition by adiponectin under our experimental conditions, whereas effects on growth were not reported in the study that used higher adiponectin concentrations.
Our study was limited to two cell lines. Data from further in vitro experiments with additional cell lines, as well as in vivo models, will be of interest in establishing to what extent our results are generalizable.
Our data are, in part, consistent with a recent report (17) that also showed growth inhibitory actions of metformin for prostate cancer cells. Whereas the authors of that report concluded that AMPK activation is not required for metformin action, that interference was based on the interpretation that siRNA against AMPKα1 completely abolished its expression, which is uncertain. Our evidence from the present and prior studies (13, 27) is consistent with a role for AMPK activation in metformin action in vitro.
Metformin is commonly used in the treatment of type II diabetes and lowers both the hyperglycemia and hyperinsulinism associated with this disease (28). There is evidence for multiple molecular mechanisms of metformin action, but recent data suggest that metformin exposure leads to LKB1-dependent AMPK pathway activation in hepatocytes, which suppresses glucogenesis (12). This, in turn, reduces both hepatic glucose output and hyperglycemia and is associated with a secondary decline in insulin levels. We recently showed that in breast cancer cells, metformin acts as a growth inhibitor by a mechanism involving AMPK activation, and here we extend these results to colon and prostate cancer cell lines. It is interesting that metformin acts in several ways that may reduce the effect of obesity-associated metabolic changes on neoplasia. First, metformin lowers insulin levels, an action that may be relevant in view of evidence that insulin can stimulate the proliferation of neoplastic cells (15, 14). Second, the drug may act to increase AMPK activation in cancer cells, resulting in direct growth inhibition, an action that may be particularly relevant in obese patients who have low levels of adiponectin, which we show here can act as an endogenous AMPK activator and growth inhibitor. We speculate that metformin (or other AMPK activators; ref. 29) may be clinically useful as an adjuvant cancer treatment or prevention strategy in metabolically defined subsets of patients, as illustrated in Fig. 6. These subsets may be better identified by the use of serum analytes such as fasting insulin, C-peptide, insulin-like growth factor binding protein 1, or adiponectin than by the use of body mass index or other anthropomorphic measurements because the “normal-weight, metabolically obese” phenotype is common in developed countries (30). Although early reports suggest the possibility of clinical relevance (18, 19, 31), further translational research in this area is needed.

Model of relationships between obesity, adiponectin, insulin, and neoplasia. A, adiponectin is an LKB1/AMPK activator that acts via tuberous sclerosis complex 1/tuberous sclerosis complex 2 to inhibit mTOR signaling and protein translation, resulting in growth inhibition. B, in obesity, circulating adiponectin levels are reduced, which we hypothesize leads to reduced AMPK-mediated inhibition of mTOR, which in turn leads to increased proliferation. This may be further accentuated by the hyperinsulinemia associated with obesity. C, metformin activates the LKB1/AMPK pathway. In the liver, this leads to decreased gluconeogenesis, resulting in lower circulating glucose and, therefore, lower circulating insulin (12). Metformin may also act directly on neoplastic cells to stimulate the LKB1/AMPK pathway (13). This action results in reduced mTOR activation and growth inhibition.
Model of relationships between obesity, adiponectin, insulin, and neoplasia. A, adiponectin is an LKB1/AMPK activator that acts via tuberous sclerosis complex 1/tuberous sclerosis complex 2 to inhibit mTOR signaling and protein translation, resulting in growth inhibition. B, in obesity, circulating adiponectin levels are reduced, which we hypothesize leads to reduced AMPK-mediated inhibition of mTOR, which in turn leads to increased proliferation. This may be further accentuated by the hyperinsulinemia associated with obesity. C, metformin activates the LKB1/AMPK pathway. In the liver, this leads to decreased gluconeogenesis, resulting in lower circulating glucose and, therefore, lower circulating insulin (12). Metformin may also act directly on neoplastic cells to stimulate the LKB1/AMPK pathway (13). This action results in reduced mTOR activation and growth inhibition.
Disclosure of Potential Conflicts of Interest
No potential conflicts of interest were disclosed.