


Despite considerable interest, the relationship between circulating 25-hydroxyvitamin D and the risk of hip fracture is not fully established.
The objective of the study was to study the association between serum 25-hydroxyvitamin D concentrations [s-25(OH)D] and the risk of hip fracture in Norway, a high-latitude country that has some of the highest hip fracture rates worldwide.
A total of 21 774 men and women aged 65–79 years attended 4 community-based health studies during 1994–2001. Information on subsequent hip fractures was retrieved from electronic hospital discharge registers, with a maximum follow-up of 10.7 years. Using a stratified case-cohort design, s-25(OH)D was determined by HPLC-atmospheric pressure chemical ionization-mass spectrometry in stored serum samples in hip fracture cases (n = 1175; 307 men, 868 women) and in gender-stratified random samples (n = 1438). Cox proportional hazards regression adapted for the case-cohort design was performed.
We observed an inverse association between s-25(OH)D and hip fracture; those with s-25(OH)D in the lowest quartile (<42.2 nmol/L) had a 38% [95% confidence interval (CI) 9–74%] increased risk of hip fracture compared with the highest quartile (≥67.9 nmol/L) in a model accounting for age, gender, study center, and body mass index. The association was stronger in men than in women: hazard ratio 1.65 (95% CI 1.04–2.61) vs hazard ratio 1.25 (95% CI 0.95–1.65).
In this prospective case-cohort study of hip fractures, the largest ever reported, we found an increased risk of hip fracture in subjects in the lowest compared with the highest quartile of serum 25-hydroxyvitamin D. In accordance with the findings of previous community-based studies, low vitamin D status was a modest risk factor for hip fracture.
The highest incidence rate of hip fractures worldwide has been reported in Oslo, Norway (1, 2). The causes of these high rates in Norway, and in the other Scandinavian countries, are not known (1). Considerable attention has been given to the relation between low vitamin D status and osteoporotic fractures.
Vitamin D is essential for intestinal calcium absorption and for maintaining calcium homeostasis and skeletal integrity (3). A well-known consequence of vitamin D deficiency is secondary hyperparathyroidism, which may lead to bone resorption, osteoporosis, and increased fracture risk (3). Some (4–6) but not other (7, 8) studies have found a positive association between vitamin D status and bone mineral density in Caucasian populations. It has therefore been suggested that vitamin D may not be a major determinant of bone health in populations with generally adequate vitamin D and calcium status (7, 8). However, vitamin D may influence fracture risk through not only bone metabolism but also through muscle function and the risk of falling (9).
Most prospective studies investigating the role of vitamin D status in fracture risk included a low number of hip fractures and analyzed all fractures as outcome (7, 10–14). Some have not been able to establish any association (7, 12). However, an increased fracture risk has been reported at 25-hydroxyvitamin D [25(OH)D] concentrations levels below 30 nmol/L in The Netherlands (13) and below 40 nmol/L or 50 nmol/L in Sweden (11, 14). The association between serum 25(OH)D [s-25(OH)D] and hip fracture (as the main outcome) has been studied in 3 prospective studies from the United States: The National Health and Nutrition Examination Survey III (15), the Osteoporotic Fractures in Men study (16), and the Women's Health Initiative (17), the latter being the largest prospective study of which we are aware with vitamin D status in blood determined at baseline and hip fracture as outcome, including 400 cases. They observed a statistically significant trend of increasing risk of hip fracture through decreasing quartiles of 25(OH)D.
Meta-analyses of randomized controlled trials concluded that supplementation with vitamin D in combination with calcium has a modest preventive effect on hip fracture, whereas a preventive effect has not been established for vitamin D alone (18–20). In a reanalysis of data from 11 randomized controlled trials, only the highest actual intake levels (≥792 IU/d) were significantly associated with a reduced risk of hip fracture (21).
The aim of this study was to investigate the association between serum 25-hydroxyvitamin D levels [the sum of 25(OH)D2 + 25(OH)D3] and risk of hip fracture during up to 11 years of follow-up in community-dwelling older adults in the country with the world's highest hip fracture incidence.
Materials and Methods
As part of the Norwegian Epidemiologic Osteoporosis Studies (NOREPOS) research collaboration (www.norepos.no), we performed a gender-stratified case-cohort study (22, 23) using baseline data from 4 population-based studies in Norway: the Tromsø Study (Tromsø IV) (latitude 69°N) in 1994–1995 (www.tromsostudy.com), the Nord-Trøndelag Health Study (HUNT 2) (63–65°N) in 1995–1997 (www.ntnu.edu/hunt), the Hordaland Health Study (HUSK) (60°N) in 1997–1999 (husk-en.b.uib.no), and the Oslo Health Study (HUBRO) (59°N) in 2000–2001 (www.fhi.no/hubro-en).
Study population
The total cohort included 21 774 home-dwelling men and women aged 65–79 years. The lower age limit was set to define an elderly group, and the higher age limit was set to reduce censoring due to deaths. In Tromsø IV and HUNT 2, age distribution of participants at baseline was 65–79 years, whereas the participants in HUSK study comprised individuals aged 70–73 years and in HUBRO aged 75–77 years.
Baseline information
Baseline examinations included collection of nonfasting blood samples, which were frozen and stored; measurements of weight, height, and blood pressure; and self-administered questionnaires. The 4 studies are part of the Cohort of Norway (24); thus, standardized questionnaire data and background data were available. Questionnaires included information on previous fracture, physical activity, cigarette smoking, chronic diseases, self-perceived health, and use of medications. Body mass index (BMI; kilograms per square meter) was calculated. A question on current health status with 4 response alternatives was dichotomized into a variable indicating good/very good vs poor/not so good self-rated health. The following question was asked: “do you currently smoke cigarettes daily?” Participants answering yes were defined as smokers. Participants were categorized as physically active or inactive according to their response on 2 4-graded questions concerning weekly frequency of hard and moderate physical activity during leisure time. Education was assessed as number of years of completed education. Questions on whether the participant suffered or had ever suffered from chronic diseases, including osteoporosis, or had experienced adverse events, including fracture of the wrist or hip, were answered with yes or no. Open-ended questions about medication use were included in HUBRO, HUSK, and Tromsø IV and were coded according to the Anatomical Therapeutic Chemical Classification System. Those reporting medications with Anatomical Therapeutic Chemical Classification codes G03 C and F were defined as estrogen therapy users. In HUNT 2, only women younger than 70 years were asked about estrogen therapy, and those with the response of currently were defined as current users. In addition, HUBRO included the question, “do you or have you used estrogen (tablets or patches)?” All of those answering “yes, currently” to this question were also included in the category of estrogen therapy users. Although 99.0% (1162 cases and 1338 noncases) had valid measurements of weight and height, the response rates on questionnaire data ranged from 98.5% (self-rated health) to 77.6% (physical activity).
Deaths and emigration
Dates of death or emigration were obtained from the Norwegian Population Register and follow-up time was calculated. End of follow-up was December 31, 2004, in Tromsø IV and HUNT 2, December 31, 2007, in HUBRO, and December 31, 2008, in HUSK, yielding a maximum follow-up of 10.7 years.
Identification of hip fractures
Information about hip fractures was obtained from fracture registers at each study site. A hip fracture was defined as the first fracture of the proximal femur occurring during the observation period. In Tromsø IV and HUNT 2, cases included the diagnoses of fracture of the femoral neck and pertrochanteric fracture, whereas the case definition in HUSK and HUBRO also included subtrochanteric hip fractures. The discharge diagnoses used to classify a hip fracture were according to the International Classification of Diseases, ninth revision (code 820-820.9) and International Classification of Diseases, 10th revision (codes S72.0, S72.1, and S72.2).
In Tromsø IV, hip fractures subsequent to the baseline examination until moving out of the Tromsø municipality or the end of follow-up were retrieved from the radiographic archives and validated against the patient discharge records at the University Hospital of Northern Norway, Tromsø (25). In HUNT 2, hip fractures treated in Levanger or Namsos hospitals, the only 2 hospitals in Nord-Trøndelag, were obtained from the electronic registers of the Nord-Trøndelag Hospital Trust (26). In HUSK, the computerized discharge diagnosis records of the 6 hospitals serving Hordaland County were searched for diagnosis codes. All admittances with diagnosis codes indicating femoral fracture with a corresponding surgical procedure indicating a primary operation for hip fracture were defined as incident hip fractures (27). In HUBRO, hip fractures were retrieved by linkage to the electronic discharge registers in the 5 hospitals treating hip fractures in Oslo by performing a broad search on all diagnosis codes for femur fractures as well as surgical procedure codes for fracture surgery in femur and hip arthroplasty. True primary hip fractures were confirmed by reviewing patients' medical records, except in 1 hospital in which only 42% of the retrieved hospital stays were verified in medical records because the remainder was no longer electronic accessible. For 84 admissions not reviewed in medical records (16.2%), a hip fracture diagnosis was confirmed if the hospital stay included a surgical procedure characteristic for a primary operation for hip fracture, corresponding to the method used in HUSK.
Selection of cases and the subcohort
All participants who suffered a hip fracture during follow-up were included as cases. Participants with self-reported previous fractures or fractures occurring prior to their date of attendance, but not during the observation period, were treated as noncases. The gender-specific subcohorts were defined as random unmatched samples of 4.5% of men and 9.0% of women in the study population at baseline. These inclusion fractions were chosen so that the subcohorts within each gender would be approximately the same size as the number of cases.
Serum sample analyses
Frozen serum samples were sent to AS Vitas (Oslo, Norway) where they were analyzed in 2011. Samples from cases and noncases at each study center were analyzed simultaneously. Biobank staff and laboratory staff were blinded with regard to case status. 25-Hydroxyvitamin D2 and 25-hydroxyvitamin D3 in serum were determined by HPLC- atmospheric pressure chemical ionization (APCI)-mass spectrometry (28). One hundred fifty microliters of human plasma were diluted with 450 μL 2-propanol containing butylated hydroxytoluene as an antioxidant. After thorough mixing (15 minutes) and centrifugation (10 minutes, 4000 × g at 10°C), an aliquot of 35 μL was injected from the supernatant into the HPLC system. HPLC was performed with a HP 1100 liquid chromatograph (Agilent Technologies, Palo Alto, California) interfaced by APCI to a HP mass spectrometric detector (MS) operated in single-ion monitoring mode. Vitamin D analogs were separated on a 4.6- × 50-mm reversed-phase column with 1.8 μM particles. The column temperature was 80°C. A 2-point calibration curve was made from analysis of albumin solution enriched with known vitamin D concentration. Recovery is 95%, the method is linear from 5–400 nM at least, and the limit of detection is 1–4 nM. Coefficients of variation for interassay analyses were 7.6% at s-25(OH)D, 47.8 nmol/L, and 6.9% at s-25(OH)D, 83.0 nmol/L.
Statistical analyses
Data management was done in PASW Statistics 17 /IBM SPSS 20 (IBM Corp, Armonk, New York), and main statistical analyses were performed in R (29). We performed Cox proportional hazards regression adjusted for a gender-stratified case-cohort design (22, 23), using the case-cohort function cch in the R package Survival (30). Age is accounted for through the flexible baseline in Cox regression. We initially performed Cox regression with penalized splines of s-25(OH)D (31) to examine the trends in hip fracture hazard over the full distribution of s-25(OH)D. In addition, we examined hazard ratios according to quartiles of s-25(OH)D. Quartile limits were based on distribution of 25(OH)D in the subcohort. Gender-specific quartile limits were used in the gender-specific analyses. Additional analyses were performed using pooled month-specific quartiles of s-25(OH)D to account for seasonal variation (32). We also performed a subgroup analysis including only those who did not report prevalent osteoporosis at baseline examination, and we performed additional study center-specific analyses in which we scrutinized the association between s-25(OH)D and hip fracture within each study center. Potential confounders considered were BMI, cigarette smoking, physical inactivity, education, and self-rated health. Tests and plots of Schoenfeld residuals (31) revealed nonproportional hazards for the study centers, suggesting a time-dependent effect of study center on hip fracture hazard. Using strata allowing for different baseline hazards by study center yielded virtually identical results as when including the variable as a factor. Study center is therefore included as an adjustment variable.
Results
Incident hip fractures
During a median observation time of 8.2 years, 1232 individuals [340 men (3.4%) and 892 women (7.5%)] suffered a hip fracture. The randomly sampled subcohorts included 1502 individuals, of whom 93 became cases. Intact frozen serum samples were obtained and successfully analyzed for 2526 participants (95.6% of those selected). Missing serum was equally distributed among cases and noncases. The number included in the presented analyses are 2500 with valid BMI data (94.7% of those selected), of whom 1162 were hip fracture cases (Figure 1).
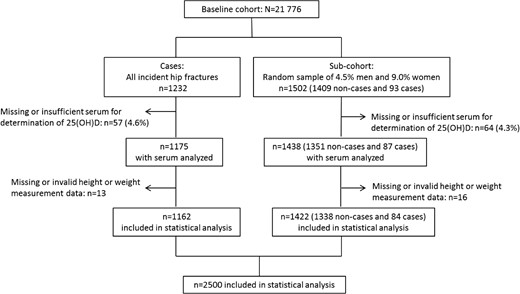
Inclusion of participants to the case and subcohort groups in the NOREPOS study. The cases present in the subcohort (n = 93 originally sampled; n = 84 included in statistical analysis) are duplicates of hip fracture patients occurring in the case group.
Characteristics of the study population
Baseline characteristics according to whether participants suffered a hip fracture during the observation period are shown in Table 1. Cases were on average older at baseline, and a higher proportion of cases reported previous fractures. Among women, cases also had significantly lower BMI, poorer self-rated health, higher smoking prevalence, and a higher prevalence of osteoporosis.
Baseline Characteristics Comparing Participants Who Experienced a Hip Fracture With Participants Who Were Free of Hip Fracture Until the End of Follow-Up: A NOREPOS Study
| Men | Women | |||||||
|---|---|---|---|---|---|---|---|---|
| n | No Hip Fracture (n = 400)a | Hip Fracture (n = 307) | P Valueb | n | No Hip Fracture (n = 951)a | Hip Fracture (n = 868) | P Valueb | |
| Age, mean (SD), y | 707 | 71.8 (3.9) | 73.1 (3.2) | <.001 | 1819 | 72.2 (3.9) | 73.5 (3.4) | <.001 |
| s-25(OH)D, mean (SD), nmol/L | 707 | 57.8 (20.5) | 55.9 (19.8) | .20 | 1819 | 55.7 (21.1) | 55.2 (21.7) | .64 |
| BMI, mean (SD), kg/m2 | 701 | 26.4 (3.8) | 25.9 (3.8) | .12 | 1799 | 27.4 (4.5) | 25.8 (4.4) | <.001 |
| Body height, mean (SD), cm | 703 | 173.7 (5.8) | 174.5 (6.4) | .065 | 1801 | 159.9 (5.8) | 160.2 (6.1) | .45 |
| Education, mean (SD), y | 639 | 8.9 (4.1) | 8.3 (3.5) | .070 | 1526 | 7.5 (3.1) | 7.5 (3.1) | 1.00 |
| Good or very good self-rated health, n, % | 700 | 235 (59.2) | 163 (53.8) | .18 | 1788 | 506 (54.1) | 393 (46.1) | .001 |
| Daily cigarette smoker, n, % | 681 | 88 (22.8) | 82 (27.8) | .16 | 1745 | 165 (18.3) | 202 (24.0) | .004 |
| Inactive during leisure time, n, % | 591 | 20 (6.0) | 21 (8.2) | .36 | 1368 | 96 (13.1) | 98 (15.4) | .27 |
| History of hip fracture, n, % | 616 | 10 (2.8) | 18 (6.9) | .026 | 1455 | 39 (5.1) | 71 (10.4) | <.001 |
| History of wrist fracture, n, % | 616 | 32 (8.9) | 40 (15.6) | .016 | 1511 | 220 (27.6) | 285 (39.9) | <.001 |
| Osteoporosis, n, % | 597 | 5 (1.5) | 3 (1.2) | 1.00 | 1453 | 84 (11.1) | 164 (23.6) | <.001 |
| Estrogen therapy, n, % | – | – | – | – | 1819 | 79 (8.3) | 71 (8.2) | .99 |
Subcohort excluding cases (16 men, 71 women).
ANOVA for continuous variables, χ2 test for factor variables, and Fisher's exact test for osteoporosis in men due to low cell counts.
Serum 25-hydroxyvitamin D
Overall median (25th and 75th percentiles) s-25(OH)D in the randomly sampled subcohort was 53.5 (42.2, 67.8) nmol/L. s-25(OH)D was slightly higher in men than in women (median 55.5 vs 52.5 nmol/L, P = .07). It was similar across study centers except in HUBRO at which it was higher (median 61.6 nmol/L, P < .001 for HUBRO vs the other study centers). Baseline characteristics according to quartiles of s-25(OH)D are shown in Tables 2 and 3 for the respective gender-specific subcohorts. In men, participants were older in the highest s-25(OH)D quartile, and the prevalence of smoking and physical inactivity was lower at higher s-25(OH)D, although this was not statistically significant. In women there was a clear inverse relationship between BMI and s-25(OH)D (Spearman's rho= −0.11 (P = .001)).
Baseline Characteristics of Male Subcohort Across Quartiles of s-25(OH)D: A NOREPOS Study
| n | First Quartile, 9.9–43.3 nmol/L (n = 104) | Second Quartile, 43.6–55.4 nmol/L (n = 104) | Third Quartile, 55.6–69.1 nmol/L (n = 104) | Fourth Quartile, 69.2–156.4 nmol/L (n = 104) | P Valuea | |
|---|---|---|---|---|---|---|
| s-25(OH)D, mean (SD), nmol/liter | 416 | 34.0 (7.5) | 50.0 (7.5) | 61.7 (4.1) | 83.7 (15.9) | <.001 |
| Age, mean (SD), y | 416 | 71.9 (4.0) | 72.1 (3.8) | 71.0 (3.6) | 72.5 (4.0) | .044 |
| Study center | ||||||
| Tromsø (Tromsø IV), n, % | 416 | 11 (10.6) | 15 (14.4) | 13 (12.5) | 8 (7.7) | |
| Nord-Trøndelag (HUNT 2), n, % | 68 (65.4) | 61 (58.7) | 65 (62.5) | 58 (55.8) | ||
| Hordaland (HUSK), n, % | 19 (18.3) | 14 (13.5) | 16 (15.4) | 14 (13.5) | ||
| Oslo (HUBRO), n, % | 6 (5.8) | 14 (13.5) | 10 (9.6) | 24 (23.1) | .041 | |
| Season of blood sample | ||||||
| Summer (April through September), n, % | 416 | 35 (33.7) | 44 (42.3) | 51 (49.0) | 48 (46.2) | |
| Winter (October through March), n, % | 69 (66.3) | 60 (57.7) | 53 (51.0) | 56 (53.8) | .13 | |
| BMI, mean (SD), kg/m2 | 412 | 27.0 (4.3) | 26.1 (3.4) | 25.9 (4.0) | 26.3 (3.4) | .22 |
| Body height, mean (SD), cm | 414 | 173.0 (5.9) | 173.8 (5.6) | 174.0 (5.6) | 174.0 (6.1) | .56 |
| Education, mean (SD), y | 381 | 8.6 (4.0) | 9.1 (4.1) | 9.1 (4.3) | 8.6 (3.9) | .69 |
| Self-rated health, good or very good, n, % | 413 | 55 (53.4) | 62 (59.6) | 67 (65.0) | 58 (56.3) | .36 |
| Daily cigarette smoker, n, % | 401 | 26 (25.5) | 26 (26.8) | 25 (25.5) | 15 (14.4) | .12 |
| Inactive during leisure time, n, % | 349 | 8 (9.9) | 6 (6.9) | 3 (3.2) | 3 (3.4) | .21 |
| History of hip fracture, n, % | 372 | 0 | 4 (4.3) | 3 (3.3) | 3 (3.2) | .22 |
| History of wrist fracture, n, % | 374 | 7 (7.6) | 11 (11.8) | 6 (6.3) | 12 (12.8) | .36 |
| Osteoporosis, n (%) | 357 | 1 (1.1) | 1 (1.2) | 1 (1.1) | 2 (2.2) | .94 |
ANOVA for continuous variables, χ2 test for factor variables, and Fisher's exact test for physical inactivity, history of hip fracture, and osteoporosis due to low cell counts.
Risk of hip fracture according to serum 25-hydroxyvitamin D
We observed an inverse association between s-25 (OH)D and hazard of hip fracture (Figure 2), with increasing risk estimates across decreasing quartiles of s-25 (OH)D (Table 4). Cox regression with penalized splines revealed a linear association between s-25(OH)D and hazard ratio (HR) of hip fracture (P = .008). When entering s-25(OH)D as a continuous variable, HR [95% confidence interval (CI)] was 1.13 (1.03, 1.25) per 25 nmol/L lower s-25(OH)D in a model accounting for age, gender, study center, and BMI (P = .014).
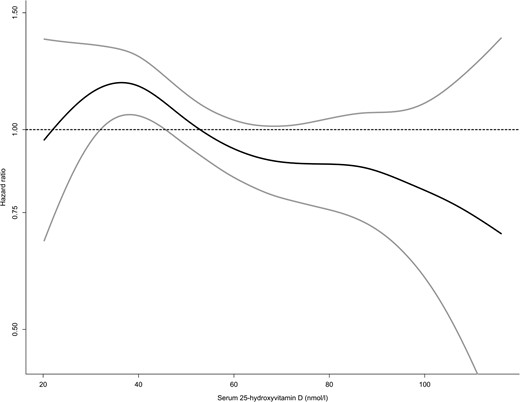
Distribution of HR (black line) with 95% CI (grey lines) for hip fracture across the distribution of s-25(OH)D (nanomoles per liter) in the NOREPOS study based on Cox proportional hazards regression with penalized splines of s-25(OH)D in a model including age, gender, study center, and BMI, with robust variance estimates and inverse probability weighting for sampling fraction to the subcohort. An HR of 1 represents the average hazard in the data. Serum 25(OH)D values ranging from the first to the 99th percentile in the subcohort are included.
Baseline Characteristics of Female Subcohort Across Quartiles of s-25(OH)D: A NOREPOS Study
| n | First Quartile, 4.5–41.4 nmol/L (n = 256) | Second Quartile, 41.6–52.5 nmol/L (n = 255) | Third Quartile, 52.5–67.0 nmol/L (n = 255) | Fourth Quartile, 67.0–193.9 nmol/L (n = 256) | P Valuea | |
|---|---|---|---|---|---|---|
| s-25(OH)D, mean (SD), nmol/L | 1022 | 32.2 (6.4) | 47.1 (3.0) | 59.5 (4.2) | 84.2 (15.1) | |
| Age, mean (SD), y | 1022 | 72.5 (3.9) | 71.8 (4.0) | 72.4 (3.7) | 72.6 (3.7) | .10 |
| Study center | ||||||
| Tromsø (Tromsø IV), n, % | 1022 | 24 (9.4) | 41 (16.1) | 30 (11.8) | 21 (8.2) | |
| Nord-Trøndelag (HUNT 2), n, % | 161 (62.9) | 149 (58.4) | 149 (58.4) | 132 (51.6) | ||
| Hordaland (HUSK), n, % | 45 (17.6) | 31 (12.2) | 37 (14.5) | 45 (17.6) | ||
| Oslo (HUBRO), n, % | 26 (10.2) | 34 (13.3) | 39 (15.3) | 58 (22.7) | <.001 | |
| Season of blood sample | ||||||
| Summer (April through September), n, % | 1022 | 92 (35.9) | 105 (41.2) | 107 (42.0) | 128 (50.0) | |
| Winter (October through March), n, % | 164 (64.1) | 150 (58.8) | 148 (58.0) | 128 (50.0) | .014 | |
| BMI, mean (SD), kg/m2 | 1010 | 27.9 (4.8) | 27.6 (4.3) | 27.0 (4.6) | 26.7 (4.3) | <.001 |
| Body height, mean (SD), cm | 1011 | 159.8 (6.0) | 160.2 (5.8) | 160.1 (6.0) | 159.9 (5.5) | .80 |
| Education, mean (SD), y | 861 | 7.3 (2.8) | 7.4 (3.0) | 7.6 (3.2) | 7.7 (3.2) | .32 |
| Self-rated health, good or very good, n, % | 1005 | 120 (47.8) | 137 (54.2) | 128 (51.4) | 147 (58.3) | .11 |
| Daily cigarette smoker, n, % | 972 | 47 (19.3) | 44 (18.1) | 42 (17.4) | 49 (20.0) | .88 |
| Inactive during leisure time, n, % | 779 | 32 (17.4) | 29 (15.5) | 22 (11.2) | 23 (10.9) | .16 |
| History of hip fracture, n, % | 829 | 14 (7.0) | 7 (3.3) | 15 (7.5) | 12 (5.6) | .25 |
| History of wrist fracture, n, % | 857 | 53 (25.6) | 59 (26.8) | 64 (30.6) | 65 (29.4) | .65 |
| Osteoporosis, n, % | 817 | 26 (13.1) | 27 (12.7) | 17 (8.8) | 28 (13.2) | .47 |
| Estrogen therapy, n, % | 1022 | 19 (7.4) | 15 (5.9) | 22 (8.6) | 25 (9.8) | .41 |
ANOVA for continuous variables and χ2 test for factor variables.
Hazard Ratios for Hip Fracture According to Quartiles of s-25(OH)D Concentration (Nanomoles per Liter) (Cox Proportional Hazards Regression Adjusted for a Gender-Stratified Case-Cohort Design): A NOREPOS Studya
| 25(OH)D Range, nmol/L | Hip Fx, n | HRb | 95% CIb | HRc | 95% CIc | HRd | 95% CId | |
|---|---|---|---|---|---|---|---|---|
| All | ||||||||
| Q1 | 4.5–42.1 | 317 | 1.27 | 1.01–1.59 | 1.38 | 1.09–1.74 | 1.34 | 1.05–1.70 |
| Q2 | 42.2–53.5 | 294 | 1.13 | 0.90–1.43 | 1.16 | 0.92–1.46 | 1.13 | 0.90–1.44 |
| Q3 | 53.5–67.8 | 272 | 1.13 | 0.90–1.42 | 1.12 | 0.88–1.41 | 1.10 | 0.87–1.39 |
| Q4 | 67.9–250.0 | 279 | 1.00 | (Referent) | 1.00 | (Referent) | 1.00 | (Referent) |
| Men | ||||||||
| Q1 | 9.9–43.3 | 82 | 1.56 | 0.99–2.46 | 1.65 | 1.04–2.61 | 1.55 | 0.95–2.51 |
| Q2 | 43.6–55.4 | 74 | 1.29 | 0.82–2.01 | 1.27 | 0.81–1.99 | 1.24 | 0.77–1.98 |
| Q3 | 55.6–69.1 | 69 | 1.10 | 0.69–1.74 | 1.06 | 0.66–1.69 | 1.07 | 0.66–1.73 |
| Q4 | 69.2–156.4 | 79 | 1.00 | (Referent) | 1.00 | (Referent) | 1.00 | (Referent) |
| Women | ||||||||
| Q1 | 4.5–41.5 | 227 | 1.14 | 0.87–1.48 | 1.25 | 0.95–1.65 | 1.23 | 0.92–1.63 |
| Q2 | 41.6–52.5 | 208 | 1.06 | 0.81–1.38 | 1.10 | 0.84–1.45 | 1.09 | 0.82–1.44 |
| Q3 | 52.5–67.0 | 212 | 1.12 | 0.86–1.47 | 1.16 | 0.88–1.52 | 1.14 | 0.86–1.49 |
| Q4 | 67.0–250.0 | 211 | 1.00 | (Referent) | 1.00 | (Referent) | 1.00 | (Referent) |
Abbreviation: Fx, fracture.
Quartiles based on distribution in the subcohorts. Data set restricted to those with valid BMI measurement (1162 cases, 1338 noncases in subcohort).
Age, gender, and study center.
Age, gender, study center, and BMI.
Age, gender, study center, BMI, and month of blood sample.
Those with an s-25(OH)D in the lowest quartile (<42.2 nmol/L) had a statistically significant 38% (95% CI 9%–74%) increased risk of hip fracture compared with the highest quartile (≥67.9 nmol/L) in a model accounting for age, gender, study center, and BMI (Table 4). The trend across quartiles was statistically significant (P = .009). The association was statistically significant in men (HR 1.65, 95% CI 1.04–2.61) but not in women (HR 1.25, 95% CI 0.95–1.65).
The interaction term between gender and s-25(OH)D on HR of hip fracture was not statistically significant. The association in the genders combined analysis persisted after adjustment for calendar month of blood sample (HR 1.34, 95% CI 1.05–1.70). Further adjustment for cigarette smoking, physical inactivity, and self-rated health yielded similar results. In an additional analysis using month-specific quartiles of s-25(OH)D as exposure (32), HR was 1.32 (95% CI 1.04–1.67) in men and women combined in a model including age, gender, study center, and BMI.
Excluding those with self-reported osteoporosis at baseline strengthened the association somewhat: HR 1.49 (95% CI 1.16–1.91) for quartile (Q) 1 vs Q4 in genders combined, and HR 1.34 (95% CI 1.00–1.81) in women, in the model including age, study center, and BMI. The association in men was not influenced by excluding those with osteoporosis due to the very low prevalence of osteoporosis in men.
In additional analyses restricted to each study center, a similar association between s-25(OH)D and risk of hip fracture was observed within all study centers. The risk estimates were higher in men than in women, except in Tromsø where the risk estimate was higher in women. However, the only significant associations were seen in HUBRO (180 hip fractures) in which the overall HR (95% CI) for Q1 vs Q4 was 2.03 (1.12–3.69) in a BMI-adjusted model.
Discussion
In this large case-cohort study, we observed a modest inverse association between s-25(OH)D and hip fracture during up to 10.7 years of follow-up. In our community-dwelling elderly population, there was a 38% (95% CI 9%–74%) increased risk of hip fracture in the lowest (<42.2 nmol/L) compared with the highest quartile (≥69.7 nmol/L) of 25(OH)D after accounting for the effects of age, gender, study center, and BMI.
To appraise our results relative to previous studies, we have plotted relative risks with 95% confidence intervals for hip fracture at 25(OH)D concentrations below 50 nmol/L in prospective studies including our own (Figure 3). In addition to our study, we identified published data from 5 prospective studies on baseline s-25(OH)D in a total of 843 Caucasian subjects with hip fracture (216 men and 627 women) (14–17, 33). Variations in biochemical assays, statistical adjustments, age differences, and other discrepancies between populations may hamper comparisons between studies. However, all published studies reporting relative risk estimates for hip fractures found estimates in favor of an increased risk at lower 25(OH)D, although with varying precision.
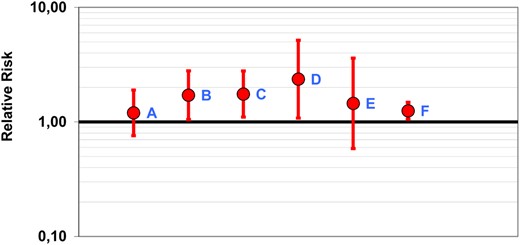
Relative risk estimates with 95% confidence intervals for hip fracture at plasma 25(OH)D of less than 50 nmol/L in prospective studies. The diagram was made using the Rothman's Episheet (40). A, Study of Osteoporotic Fractures: women, 133 hip fractures, RIA, less than 47.5 nmol/L vs 47.5 nmol/L or greater (33). B, Women's Health Initiative: women, 400 hip fractures, RIA, 47.5 nmol/L or less (25th percentile) vs 70.7 nmol/L or greater (75th percentile) (17). C, National Health and Nutrition Examination Survey III: men and women, 156 hip fractures, RIA (15). D, Osteoporotic Fractures in Men: men, 81 hip fractures, liquid chromatography and tandem mass spectrometry, 47.5 nmol/L or less (25th percentile) vs 70.7 nmol/L or greater (75th percentile) (16). E, Uppsala Longitudinal Study of Adult Men: men, 73 hip fractures, HPLC-APCI-MS, 25(OH)D less than 40 nmol/L (fifth percentile) vs 40 nmol/L or greater (14). F, NOREPOS: men and women, HPLC-APCI-MS, 1162 hip fractures.
There is a large variation in 25(OH)D concentrations from different assays and laboratories in the same blood samples (34, 35). We therefore chose to present hazard ratios according to relative distribution (quartiles) rather than absolute limits. In our data, the 25th and 75th percentiles (42.2 and 67.8 nmol/L) fell close to the commonly used cutoffs for defining vitamin D insufficiency or sufficiency: 50 and 75 nmol/L. As expected, in additional analyses with these commonly accepted limits, the results were similar, with a statistically significant 35% increased risk in subjects with levels less than 50 compared with greater than 75 nmol/L when adjusting for gender, study center, and BMI. These results suggest a preventive effect of levels above 75 nmol/L compared with levels below 50 nmol/L. Hip fracture risk decreased continuously with increasing s-25(OH)D, with the steepest and most consistent decrease at levels in the magnitude of 40–60 nmol/L (Figure 2). Additional analyses yielded significantly increased hazard ratios for hip fracture at levels less than 50 compared with 50–75 nmol/L (HR 1.21, 95% CI 1.01–1.45) but not at levels of 50–75 nmol/L compared with greater than 75 nmol/L (HR 1.12, 95% CI 0.88–1.42).
Excluding those reporting osteoporosis at baseline strengthened the association between low 25(OH)D and the risk of hip fracture somewhat. Current guidelines for treatment of osteoporosis recommend daily vitamin D supplementation in combination with calcium, due to its well-documented fracture prevention effect (18, 19). Women with diagnosed osteoporosis may have improved their vitamin D status. The prevalence of osteoporosis was as high in the highest as in the lowest quartile of s-25(OH)D (Table 3). The finding of a U-shaped association between 25(OH)D status and frailty in older women participating in the Study of Osteoporotic Fractures (36) also supports this notion.
Osteoporosis is a multifactorial disorder, and vitamin D may not be a major determinant of bone strength in populations with generally adequate vitamin D and calcium status. Despite living at high latitude, the population in Norway has earlier been shown to have a relatively good vitamin D status (37), likely owing to the country's coastal location with strong traditions of fatty fish and cod liver oil consumption as well as an active sun-seeking attitude. Nutritional factors other than vitamin D may also affect fracture risk and may differ between populations. Fatty fish and cod liver oil are rich in retinol, a substance that may reduce the effect of the active vitamin D hormone through competition for the nuclear receptor. Because retinol intake is high in Scandinavian countries, it would be of interest to study whether high retinol influences the observed association between serum 25(OH)D and hip fracture.
Strengths and limitations
The strengths of this study include the population-based approach, inviting age-specific samples of the general population, and the prospective design with up to 10.7 years of follow-up. The representativeness is, however, limited by the participation rates. These varied between the study centers. In the age groups included in this study, the overall attendance rates were 82% in Tromsø IV, 81% in HUNT 2, 77% in HUSK, and 53% in HUBRO.
As is common in cohort studies, the categorization of exposure was based on a single baseline measurement. However, data from the Tromsø study suggest a satisfactory tracking of individual 25(OH)D levels in serum over 14 years, similar to that of blood pressure and serum lipids (38).
The large number of events is a major strength. As far as we are aware, this is the largest existing study with hip fracture outcome and biochemical measurements at baseline, with serum sample analyses and a large number of covariates available for 1175 subjects (868 women and 307 men) who suffered a hip fracture during the observation period. We thus had sufficient statistical power to detect a risk increase of 30% in the lowest quartile of 25(OH)D compared with the 3 higher quartiles.
Another strength is that the measures of exposure and outcome were objective and retrieved from independent sources outside the baseline data collection settings. All serum samples were analyzed in the same laboratory by HPLC-APCI-MS, a highly valid 25(OH)D assay (34, 39). Samples from cases and noncases were handled and analyzed simultaneously, biobank and laboratory personnel being blinded to case status.
Heterogeneity of different health studies included in a multicenter study may introduce limitations. In this study, the HR of hip fracture did not differ significantly according to study center (not shown), and analyses stratified by study center revealed the same trend in the association between s-25(OH)D and hip fracture in all regions.
The 4 health studies are part of the Cohort of Norway collaboration (24) and were therefore coordinated to a large extent. Some variables were collected in a standard way, such as blood samples, anthropometric measurements, and common questions including physical activity, education, chronic diseases, and self-rated health. A limitation is that we had poor data on diet and supplement use and were unable to assess the influence of dietary calcium intake. However, results from previous studies (14, 15, 17) suggest that taking into account variations in dietary calcium intake in a population of home-dwelling elderly men and women in an observational cohort study would not influence the observed associations substantially.
Conclusion
In this prospective case-cohort study, the largest of its kind, we found an increased risk of hip fracture in subjects in the lowest quartile of serum 25(OH)D compared with the highest quartile. In accordance with findings of previous community-based studies, low vitamin D status was a modest risk factor for hip fracture in our population.
Acknowledgments
We acknowledge the people involved in carrying out the data collection in Tromsø IV, HUNT 2, HUSK, and HUBRO; those involved in establishing and maintaining the 4 respective hip fracture follow-up registers; those involved in data management; those involved in biobanks and blood sample handling; and the laboratory AS Vitas (Oslo, Norway) for performing the serum sample analyses. Finally, we thank the participants in the health studies in Norway. The 4 regional parts of this study were approved by the respective Regional Committees for Medical and Health Research Ethics (REC): REC West, reference 067.09; REC Central, reference 2009-714/2; REC North, reference 31/94; and REC South East, reference 08/2037-4. All study centers providing data are represented among the coauthors. K.H., S.F., C.G.G., G.G., B.S., G.S.T., and H.E.M. contributed to developing the protocol and obtaining funding. K.H. prepared the data, performed the statistical analyses, and drafted the manuscript. S.O.S. provided statistical advice. All coauthors have critically discussed the results, revised the manuscript, and accepted the final version.
This work was supported by a grant from the Research Council of Norway. The serum sample analyses in HUNT 2 were partly supported by a grant from the Central Norway Regional Health Authority.
Disclosure Summary: K.H., L.A.A., S.F., C.G.G., G.G., S.O.S., B.S., and G.S.T. have nothing to declare. R.B. has interests in Bioindex AS and Vitas AS. Bioindex was established by Birkeland Innovation, the Technology transfer office at the University of Oslo, whereas Vitas was established by the Oslo Innovation Center. H.E.M. contributes to a randomized trial of vitamin D supplementation sponsored by the University of Oslo and The Norwegian Women's Public Health Association. The trial is also supported by Fürst Medical Laboratory and Nycomed.
Abbreviations
-
APCI
atmospheric pressure chemical ionization
-
BMI
body mass index
-
CI
confidence interval
-
HR
hazard ratio
-
HUBRO
Oslo Health Study
-
HUNT 2
Nord-Trøndelag Health Study
-
HUSK
Hordaland Health Study
-
MS
mass spectrometric detector
-
NOREPOS
Norwegian Epidemiologic Osteoporosis Studies
-
25(OH)D
25-hydroxyvitamin D
-
Q
quartile
-
s-25(OH)D
serum 25(OH)D
-
Tromsø IV
Tromsø Study.
References
