


Metformin and thiazolidinediones (TZDs) are believed to exert their antidiabetic effects via different mechanisms. As evidence suggests that both impair cell respiration in vitro, this study compared their effects on mitochondrial functions. The activity of complex I of the respiratory chain, which is known to be affected by metformin, was measured in tissue homogenates that contained disrupted mitochondria. In homogenates of skeletal muscle, metformin and TZDs reduced the activity of complex I (30 mmol/l metformin, −15 ± 2%; 100 μmol/l rosiglitazone, −54 ± 7; and 100 μmol/l pioglitazone, −12 ± 4; P < 0.05 each). Inhibition of complex I was confirmed by reduced state 3 respiration of isolated mitochondria consuming glutamate + malate as substrates for complex I (30 mmol/l metformin, −77 ± 1%; 100 μmol/l rosiglitazone, −24 ± 4; and 100 μmol/l pioglitazone, −18 ± 5; P < 0.05 each), whereas respiration with succinate feeding into complex II was unaffected. In line with inhibition of complex I, 24-h exposure of isolated rat soleus muscle to metformin or TZDs reduced cell respiration and increased anaerobic glycolysis (glucose oxidation: 270 μmol/l metformin, −30 ± 9%; 9 μmol/l rosiglitazone, −25 ± 8; and 9 μmol/l pioglitazone, −45 ± 3; lactate release: 270 μmol/l metformin, +84 ± 12; 9 μmol/l rosiglitazone, +38 ± 6; and 9 μmol/l pioglitazone, +64 ± 11; P < 0.05 each). As both metformin and TZDs inhibit complex I activity and cell respiration in vitro, similar mitochondrial actions could contribute to their antidiabetic effects.
Metformin and thiazolidinediones (TZDs) are used for the treatment of type 2 diabetes. As both drugs ameliorate hyperglycemia by improving glucose metabolism of target tissues of insulin, they are particularly prescribed to patients with severe insulin resistance. Their metabolic actions differ in that metformin mainly reduces hepatic glucose release, whereas TZDs predominantly increase insulin-stimulated glucose disposal into skeletal muscle (1). Accordingly, the metabolic effects of metformin and TZDs are believed to be triggered via different primary target structures and molecular mechanisms.
Although metformin has been in clinical use for decades, the early steps that mediate its antidiabetic action are still not clear. It is established that metformin inhibits the enzymatic activity of complex I of the respiratory chain and thereby impairs both mitochondrial function and cell respiration (2–4). Mitochondrial disruption on the level of complex I is held responsible for elevated plasma lactate concentrations in metformin-treated patients (5,6), which in very rare instances can aggravate to lactic acidosis (7). There is evidence that complex I inhibition could also be the cause of metformin’s beneficial antihyperglycemic action (2,8), but this matter awaits final clarification.
At variance to the uncertainties about metformin’s initial molecular target, the antidiabetic effects of TZDs are unanimously attributed to their agonistic action on peroxisome proliferator–activated receptor (PPAR)-γ, which is predominantly expressed in fat cells (9,10) and is not addressed by metformin (11). Via activation of this nuclear receptor, TZDs modulate gene expression, trigger adipocyte differentiation, and induce remodeling of adipose tissue, which is associated with changes in adipocyte signal output (9,10,12). It is believed that adipose tissue–derived signals including free fatty acids and peptide hormones (adiponectin, resistin, leptin, and tumor necrosis factor-α) mediate the TZD-induced improvement of skeletal muscle glucose disposal (9,10,12).
TZD action via PPAR-γ and adipose tissue, however, does not exclude contributions by other mechanisms. In vitro, TZDs reduce fuel oxidation and elevate lactate release by direct action on skeletal muscle, which is obviously a group effect and independent of PPAR-γ–mediated gene expression (13,14). Such a PPAR-γ–independent shift from aerobic to anaerobic fuel utilization has likewise been described in other TZD-exposed tissues and cells and hints at an inhibition of cell respiration (15–17). Taken together, these findings suggest that TZDs could share metformin’s inhibitory influence on mitochondrial function.
The present study aimed to define better the mechanisms underlying TZD action on mitochondrial function and cell respiration in vitro and to compare directly the effects of TZDs with those induced by metformin. Parallels in the pharmacological actions of TZDs and metformin are shown and hint at a possible involvement of similar mitochondrial mechanisms in their metabolic effects. In a wider context, our findings are in line with the hypothesis that changes in the cellular energy charge could have a basic role in the pharmacological and physiological modulation of insulin sensitivity.
RESEARCH DESIGN AND METHODS
Male Sprague-Dawley rats were purchased from the breeding facilities of the University of Vienna (Himberg, Austria). They were kept at an artificial 12-h light:dark cycle at constant room temperature and, unless stated otherwise, were provided with conventional laboratory diet and tap water ad libitum. Food but not water was withdrawn overnight before rats were killed by cervical dislocation between 8:30 and 9:30 a.m. for the preparation of tissues. All experiments were performed according to local law and to the principles of good laboratory animal care.
Test compounds.
Agents examined were rotenone (a specific and irreversible inhibitor of respiratory complex I; Sigma, St. Louis, MO), metformin (1,1-dimethylbiguanide hydrochloride, inhibitory action on complex I; Sigma), troglitazone and pioglitazone (PPAR-γ agonistic TZDs; provided by Sankyo, Tokyo, Japan), rosiglitazone and RWJ-241947 (PPAR-γ agonistic TZDs, the latter also known as MCC-555; provided by Johnson & Johnson, Raritan, NJ), GI-262570 and RWJ-348260 (PPAR-γ agonists without TZD structure; provided by Roche, Basel, Switzerland, and Johnson & Johnson, respectively), PD-68235 and bisphenol A diglycidyl ether (PPAR-γ antagonists, the latter also known as BADGE; provided by Pfizer, Ann Arbor, MI, and purchased from Fluka, Buchs, Switzerland, respectively), YM440 (an oxadiazolidinedione with a structure similar to TZDs but without major PPAR-γ activity; provided by Yamanouchi, Tsukuba, Japan), glimepiride (a sulfonylurea; provided by Aventis, Frankfurt am Main, Germany), and dexlipotam [R-(+)-α-lipoic acid; provided by Viatris, Frankfurt am Main, Germany].
Complex I activity in tissue homogenates.
Immediately after killing the 5- to 7-week-old rats (∼140 g body wt), samples of gastrocnemius muscle (red part) and liver were prepared, weighed, frozen in liquid nitrogen, and stored at −70°C. For analysis, tissue specimens were thawed, cut into small pieces, and brought into 0.1 mmol/l K phosphate buffer (30 mg tissue/ml, 0°C, pH adjusted to 7.4 with KOH) containing 0.3% wt/vol fatty acid–free BSA (Roche). The tissues were then homogenized for 1 min with a Polytron homogenizer (Kriens, Switzerland) and sonicated to disrupt all cells and mitochondria (70 pulses, Labsonic U; Braun, Melsungen, Germany).
Complex I is part of the electron transport chain, which is located in the inner mitochondrial membrane, and is responsible for electron transfer from NADH to ubiquinone. Its activity was determined by a spectrophotometric assay based on the enzymatic reaction NADH + H+ + ubiquinone-1 → NAD+ + dihydroubiquinone-1. A mixture of 1.8 ml of K phosphate buffer (see above), 4 μl of KCN (0.5 mol/l in water), 4 μl of NaN3 (1 mol/l in water), 50 μl of tissue homogenate, and 4 μl of DMSO containing an appropriate concentration of the respective test compound was equilibrated at 30°C for 10 min. DMSO (0.2%, vol/vol) did not affect the rates of NADH conversion (data not shown) and was also added to control solutions used for comparison. DMSO was omitted when water soluble compounds were examined (metformin and dexlipotam). The suspension was then transferred into a quartz cuvette, and the reaction was started by the admixture of the reaction substrates: 40 μl of NADH (15 mmol/l in water; Fluka) and 80 μl of ubiquinone-1 (2.5 mmol/l in ethanol; Sigma). Photometric measurement was started immediately thereafter, and the decrease in NADH, which absorbs at 340 nm, was determined over 2 min. Specificity of the spectrophotometric assay was confirmed by complete abrogation of NADH conversion in the absence of tissue homogenate or ubiquinone-1. Furthermore, 1 μmol/l rotenone blocked NADH conversion by muscle homogenates (−96 ± 2%), which indicates quantitative dependence on complex I. In liver homogenates, approximately one-third of NADH conversion seemed to be rotenone insensitive (−64 ± 4% inhibition by 1 μmol/l rotenone).
Oxygen consumption by isolated mitochondria.
Liver mitochondria were prepared from ∼4-month-old rats (∼420 g body wt; 1 animal/preparation). After cervical dislocation, rats were decapitated and livers quickly excised and plunged into ice-cold isolation buffer (0.25 mol/l sucrose, 20 mmol/l triethanolamine, 1 mmol/l EDTA, pH 7.4, 4°C). The tissue was chopped into small pieces with scissors and washed several times with buffer to remove the contaminating blood. Livers were then homogenized (0.25 g/ml isolation buffer) in a 60-ml capacity Potter-Elvehjem tissue homogenizer (electrically driven Teflon pestle). The homogenate was centrifuged at 2,500 rpm for 10 min (SS34 rotor, Sorvall RC26 Plus centrifuge). The supernatant was decanted through two layers of cheesecloth and spun down at 9,000 rpm for 10 min. The resulting pellets were carefully resuspended using a manually driven 15-ml Potter-Elvehjem homogenizer and centrifuged for 10 min at 9,000 rpm. This procedure was repeated twice (last resuspension with a 5-ml homogenizer). The final mitochondrial suspension was carefully prepared with a 2-ml homogenizer and stored at 4°C in Eppendorf tubes. The protein content of the mitochondrial suspension (40–50 g/l) was determined by the Biuret method with BSA as a standard.
Oxygen consumption was measured in air-saturated mitochondrial isolation buffer (pH 7.4, 25°C) with a Clark-type oxygen electrode. Mitochondria (1 g protein/l) were preincubated for 3 min at 25°C in isolation buffer additionally containing 0.3% BSA (wt/vol) and the indicated concentrations of metformin, rosiglitazone, pioglitazone, or KCl (the last used as an osmotic control). Buffer with TZDs as well as the appropriate controls contained 0.2% DMSO (vol/vol), which did not affect the rates of oxygen consumption (data not shown).
For stimulating mitochondrial respiration, 4 mmol/l inorganic phosphate was then added together with 5 mmol/l glutamate + 5 mmol/l malate (substrates for complex I) or, alternatively, with 10 mmol/l succinate (substrate for complex II) + 4.5 μmol/l rotenone. After 3 min, mitochondrial respiration was accelerated by the addition of 200 μmol/l ADP allowing ATP synthesis, and the rates of oxygen consumption were measured in state 3 (i.e., in the presence of ADP). After the quantitative consumption of added ADP, the rates of oxygen consumption were measured in state 4 (i.e., in the absence of ADP). The energy-conserving capacity of mitochondria was determined by respiratory control index (state 3/state 4). As a measure of the efficiency of mitochondrial ATP synthesis, the ADP-to-oxygen ratio was calculated (total amount of ADP added to amount of oxygen consumed during state 3 respiration) (18). All measurements were done in duplicate.
Fuel metabolism of isolated skeletal muscle.
Immediately after 5- to 7-week-old rats were killed, two longitudinal soleus muscle strips per leg (i.e., four strips/rat) were prepared, weighed (∼25 mg/strip), and tied under tension on stainless steel clips as described previously (19). According to procedures used previously (13), muscles were immediately put into 50-ml Erlenmeyer flasks coated with BlueSlick solution (Serva, Heidelberg, Germany) and were placed into a shaking waterbath (three strips per flask, 37°C, 130 cycles/min). Each flask contained 20 ml of Cell Culture Medium 199 (pH 7.35, 5.5 mmol/l glucose; Sigma, cat. no. M-4530) with additions of 0.3% wt/vol BSA, 5 mmol/l HEPES, 25,000 units/l penicillin G, 25 mg/l streptomycin, and 0.2 mg/l ciprofloxacine. Palmitate was dissolved in ethanol and added to the medium to give final concentrations of 300 μmol/l palmitate and 0.25% vol/vol ethanol. Stock solutions of the test compounds (metformin in saline, all others in DMSO) were added to the medium to give the indicated final concentrations of the respective agent. The final DMSO concentration of 0.1% vol/vol did not affect metabolic rates in this experimental setting (data not shown) and was also added to the control medium. An atmosphere of 95% O2/5% CO2 was continuously provided within the flasks. Muscles were incubated for 24 h in the absence of insulin and were then transferred for 1 h into 25-ml flasks (one strip per flask) containing 3 ml of medium additionally supplemented with 100 nmol/l human insulin (Actrapid; Novo, Bagsvaerd, Denmark) and trace amounts of d-[U-14C]glucose, d-[U-14C]palmitic acid, or 2-deoxy-d-[2,6-3H]glucose plus d-[U-14C]sucrose (all from Amersham, Amersham, U.K.). At the end of the experiment, muscles were quickly removed from the flasks, blotted, and frozen in liquid nitrogen.
Later, frozen muscle strips were lysed in 1 mol/l KOH at 70°C. The net rate of glucose incorporation into glycogen is referred to as glycogen synthesis and was calculated from the conversion of [14C]glucose into [14C]glycogen as described previously (19). Rates of CO2 production from glucose (referred to as glucose oxidation) and CO2 production from palmitate were calculated from the conversion of [14C]glucose or [14C]palmitate into 14CO2, which was trapped with a solution containing methanol and phenethylamine (1:1) (20). For the measurement of muscle glycogen content, glycogen in the muscle lysate was degraded to glucose with amyloglucosidase (20) and glucose was then measured enzymatically by a commercial kit (Human, Taunusstein, Germany).
Statistics.
Absolute values and variability under the experimental conditions used are listed in Table 1 (control experiments). In the text and the figures, the effects of drug treatment are given in percentage of an intraindividual control value (=100%) as means ± SE. P values were calculated by paired two-tailed t test, with a P < 0.05 considered as significant.
RESULTS
Complex I activity in tissue homogenates.
In agreement with their established impact on complex I, rotenone (at 1–100 nmol/l) and metformin (at 10 and 30 mmol/l) dose-dependently suppressed NADH conversion in the tissue homogenates (Fig. 1). Various PPAR-γ ligands, which included TZDs and non-TZDs as well as receptor agonists and antagonists, likewise inhibited complex I. Whereas most PPAR-γ ligands reduced the rate of NADH conversion only at the highest concentration used (100 μmol/l), the TZD rosiglitazone and the PPAR-γ antagonist BADGE were more effective and exerted inhibitory action at all examined concentrations (10, 30, and 100 μmol/l).
For excluding an unspecific effect, three putative antidiabetic agents without relevant affinity to PPAR-γ were examined for comparison. Neither YM440 (lipophilic, TZD-like structure) nor glimepiride (lipophilic) or dexlipotam (hydrophilic) affected complex I activity in the homogenates.
The results were very similar in homogenates of skeletal muscle and liver, except that inhibition seemed to be less pronounced in liver homogenates. This obviously reflected that approximately one-third of NADH conversion was rotenone insensitive in liver homogenates (i.e., presumably not catalyzed by complex I).
Oxygen consumption by isolated mitochondria.
In the presence of substrates for complex I (glutamate + malate), metformin (3–30 mmol/l) dose-dependently and markedly reduced states 3 and 4 respiration of isolated mitochondria (Fig. 2). With substrate for complex II (succinate), the highest concentration of metformin used (30 mmol/l) failed to affect state 3 respiration, and a minor decrease in state 4 respiration was much less pronounced than metformin’s effect in the presence of glutamate + malate (−12 ± 4 vs. −57 ± 1%; P < 0.0001). As 30 mmol/l KCl did not share any effect exerted by metformin, an osmotic mechanism was obviously not responsible for metformin action.
Like metformin, rosiglitazone and pioglitazone (100 μmol/l) reduced state 3 respiration when glutamate + malate were provided as substrates but failed to do so in the presence of succinate + rotenone. A TZD-induced increase in state 4 respiration was seen with succinate used as the substrate (P = 0.026 for pioglitazone; only a trend for rosiglitazone, P = 0.069) but not with glutamate + malate. Metformin as well as TZDs thus impaired complex I–dependent oxidation of glutamate + malate in relation to complex II–dependent oxidation of succinate, which indicates that all of these drugs inhibit complex I.
Furthermore, metformin reduced respiratory control and the ADP-to-oxygen ratio in the presence of glutamate + malate but not in the presence of succinate. Substrate specificity suggests that this was caused by the inhibition of complex I. At variance to metformin, TZDs reduced respiratory control and the ADP-to-oxygen ratio independent of the substrate provided (although this was only a trend for ADP to oxygen in the presence of glutamate + malate). Reductions in respiratory control and ADP-to-oxygen ratio are both indicative of an increased contribution of uncoupled respiration without ATP production. TZDs therefore seem to exert uncoupling properties, which at least in part are not related to complex I inhibition and which could explain the increase in state 4 respiration with succinate.
Fuel metabolism of isolated muscle strips.
In freshly isolated native specimens of rat skeletal muscle, rotenone, metformin, and three different TZDs (rosiglitazone, pioglitazone, and RWJ-241947) dose-dependently reduced CO2 production from both glucose and palmitate and increased anaerobic glycolysis (lactate release), which suggests disruption of mitochondrial function and cell respiration (Fig. 3). On a concentration basis, rotenone was much more efficient than the TZDs, which in turn were much more efficient than metformin. Reduced mitochondrial fuel oxidation induced by rotenone, metformin, and TZDs was accompanied by increased glucose transport and blunted glycogen storage, which is obviously due to higher carbohydrate requirements for anaerobic than aerobic ATP production.
DISCUSSION
TZDs have repeatedly been reported to reduce aerobic fuel consumption and to accelerate anaerobic glycolysis in isolated tissues and cells via a mechanism that does not involve PPAR-γ (13–17). The present study suggests that this is due to the inhibition of mitochondrial complex I, because the TZDs rosiglitazone, pioglitazone, troglitazone, and RWJ-241947 consistently reduced rotenone-sensitive (i.e., complex I–mediated) NADH conversion in tissue homogenates. In this experimental setting, complex I inhibition was likewise obtained with PPAR-γ antagonists (BADGE, PD-68235) and PPAR-γ agonists that lack a TZD structure (GI-262570 and RWJ-348260). Apart from the established complex I inhibitors metformin and rotenone, compounds without major affinity to PPARs failed to exert inhibitory action, which even held true for YM440, an antidiabetic agent characterized by a TZD-like oxadiazolidinedione ring structure but with weak binding to PPAR-γ (21). Hence, a high binding affinity to PPAR-γ is associated with complex I inhibition, independent of whether the individual ligand is a receptor agonist or antagonist. This is consistent with the interpretation that complex I inhibition is not mediated by the activation of PPAR-γ but suggests that the same molecular properties could be responsible for both PPAR-γ binding and inhibition of complex I.
In parallel to what was found for PPAR-γ ligands, metformin inhibited complex I in sonicated tissue homogenates that contained disrupted mitochondria. Although this is not proof that metformin directly interacts with the enzyme complex, it is in line with previously described effectiveness of metformin in submitochondrial particles (2) but contrasts with the view that its mitochondrial actions require intact cells and extramitochondrial signal transduction (3,4).
Metformin- and TZD-induced inhibition of complex I was confirmed by the impairment of respiratory parameters of isolated mitochondria in the presence of glutamate + malate (complex I substrates). In contrast to metformin, which did not influence succinate-stimulated respiration (complex II substrate), rosiglitazone and pioglitazone in addition to their complex I inhibition led to decreased respiratory control and ADP-to-oxygen ratios with succinate as a result of increased mitochondrial oxygen consumption in state 4. TZDs therefore not only inhibit complex I activity but also uncouple oxidative phosphorylation, both effects resulting in an impaired mitochondrial energy conservation. A decade ago, other TZDs likewise were found to inhibit complex I and to induce uncoupling in isolated mitochondria, but these relevant data were published only in an abstract (22).
Consistent with complex I–dependent impairment of cell respiration, both TZDs and metformin affected fuel metabolism of isolated muscle strips in a rotenone-like manner. The conclusion that complex I inhibition underlies the observed impairment of cell respiration is corroborated by parallel relative efficacies on complex I activities in homogenates and on cell respiration in muscle strips (rotenone ≫ TZDs ≫ metformin). Because similar metabolic effects as in muscle have been described in isolated hepatocytes and perfused rat liver (8,17,23), TZDs and metformin seem to impair mitochondrial function in both of their major target tissues (1). These findings obviously challenge the paradigm that TZDs and metformin act via completely different mechanisms.
Ranking efficacies of individual TZDs on a molar basis shows that rosiglitazone is more potent than pioglitazone in disrupted mitochondria (where it has direct access to complex I), equally potent in intact mitochondria (where it has to pass the mitochondrial membrane), and less potent in intact tissue (where it additionally has to pass the plasmalemma). Relative efficacies of individual TZDs thus seem to be influenced by the presence of cytoplasmic enzymes and/or by membranes that modulate access to the site of action.
The striking parallels in the mitochondrial effects of TZDs and metformin in vitro make it tempting to speculate that complex I–dependent impairment of cell respiration could contribute to their therapeutic actions. In this context, it should be considered that TZDs are highly lipo-philic and therefore could accumulate in the mitochondrial membrane, whereas metformin is a positively charged drug, which because of the mitochondrial membrane potential has been estimated to accumulate slowly 1,000-fold within the mitochondrial matrix (2). Reliable data on drug concentrations in these relevant fractions are not available, but progressive accumulation in the vicinity of complex I would be in line with our earlier finding that troglitazone becomes a progressively more efficient inhibitor of cell respiration when the treatment period is extended (13,14). This time-dependent increase in efficacy also explains why much lower drug concentrations were effective in muscle strips that were preexposed to the drugs for 24 h than in isolated mitochondria, which do not withstand long-term incubation and, hence, were exposed for a few minutes only.
Analyzing via which cascade of events the inhibition of cell respiration could principally result in antidiabetic action; it is of note that the rapid as well as the delayed effects of TZDs and metformin to some extent resemble those of exercise and 5-aminoimidazole-4-carboxamide-1-β-d-ribofuranoside (AICAR). Like muscle contractions, metformin and TZDs immediately reduce the ratios of ATP to AMP, ATP to ADP, and phosphocreatine to creatine in vitro (3,8,24,25), which can obviously be attributed to their impact on cell respiration. AICAR is a pharmacological tool to mimic an increase in cellular AMP (26,27), which activates the enzyme AMP-activated protein kinase (AMPK) and causes catabolic responses on the short term and insulin sensitization on the long term (26–32). Reduction of cellular energy availability could therefore be a common mechanism by which muscle contractions, TZDs, and metformin activate AMPK (5,25,28,33–35); stimulate glucose transport, glycolysis, and glycogenolysis on the short term (26–28,35; and this study); and ameliorate hyperglycemia and insulin resistance on the long term (1,9,26) (Fig. 4).
With regard to metformin, this concept is further supported by marked reductions of ATP, and phosphocreatine as accompanied by increased AMPK activity in skeletal muscle of treated patients (5). Although metformin seems capable of activating AMPK also via other mechanisms than ATP depletion (25,34), these findings corroborate the idea of complex I–dependent energy depletion having a role in the therapeutic actions of metformin (5). With regard to TZDs, it was shown recently that adiponectin, possibly part of the TZD-induced signal from adipose tissue (36,37), also reduces the ATP-to-AMP ratio and activates AMPK in muscle and liver cells (38,39). This implicates a dual potential of TZDs to reduce the cellular energy charge of insulin target tissues via PPAR-γ–induced adiponectin release from adipose tissue and by metformin-like, PPAR-γ–independent inhibition of complex I and cell respiration (Fig. 4). It should be noted that this neither supports nor excludes that TZDs could, in addition, have direct effects on skeletal muscle that are PPAR-γ mediated.
Taken together, we show that TZDs, like metformin, directly inhibit complex I and cell respiration in target tissues of insulin in vitro. In a wider context, our findings support the hypothesis that changes in cellular energy availability could be a unifying early event in the physiological and pharmacological modulation of insulin sensitivity. Studies on the metabolic effects of TZDs in humans and animals in vivo will be necessary to determine to what extent the pharmacological inhibition of complex I, described here, contributes to the antidiabetic actions of these drugs.
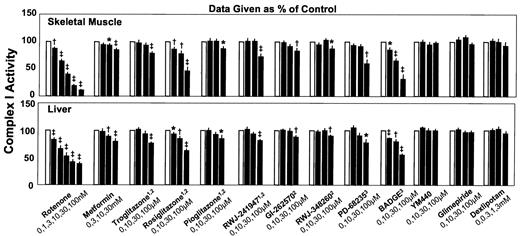
Dose-dependent effects of rotenone and various agents, to which antidiabetic potentials have been ascribed, on the enzymatic activity of respiratory complex I in homogenates of the red part of rat gastrocnemius muscle (top) and rat liver (bottom), which were sonicated to disrupt cell and mitochondrial membranes. Data are given as a percentage of an intraindividual control (=100%; □) and are means ± SE; n = 6–24 each. 1TZD, 2PPAR-γ agonist, 3PPAR-γ antagonist; *P < 0.05; †P < 0.01; ‡P < 0.001 vs. control.
Dose-dependent effects of rotenone and various agents, to which antidiabetic potentials have been ascribed, on the enzymatic activity of respiratory complex I in homogenates of the red part of rat gastrocnemius muscle (top) and rat liver (bottom), which were sonicated to disrupt cell and mitochondrial membranes. Data are given as a percentage of an intraindividual control (=100%; □) and are means ± SE; n = 6–24 each. 1TZD, 2PPAR-γ agonist, 3PPAR-γ antagonist; *P < 0.05; †P < 0.01; ‡P < 0.001 vs. control.

Effects of metformin, rosiglitazone, and pioglitazone on respiratory functions of isolated mitochondria from rat liver. KCl ( ) was used to control for osmotic effects. Rates of oxygen consumption in states 3 and 4 (i.e., in the presence and absence of ADP, respectively), the respiratory control index (ratio of rates of oxygen consumption in state 3 to state 4), and the ADP-to-oxygen ratio (P/O) are shown in the presence of glutamate + malate or succinate + rotenone. Data are given as a percentage of an intraindividual control (=100%; □) and are means ± SE; n = 4–6 each. *P < 0.05; †P < 0.01; ‡P < 0.001 vs. control.
Effects of metformin, rosiglitazone, and pioglitazone on respiratory functions of isolated mitochondria from rat liver. KCl () was used to control for osmotic effects. Rates of oxygen consumption in states 3 and 4 (i.e., in the presence and absence of ADP, respectively), the respiratory control index (ratio of rates of oxygen consumption in state 3 to state 4), and the ADP-to-oxygen ratio (P/O) are shown in the presence of glutamate + malate or succinate + rotenone. Data are given as a percentage of an intraindividual control (=100%; □) and are means ± SE; n = 4–6 each. *P < 0.05; †P < 0.01; ‡P < 0.001 vs. control.

Effects of TZDs, metformin, and rotenone on cell respiration in isolated muscle. Dose-dependent effects of 24-h exposure to rotenone, metformin, RWJ-241947, pioglitazone, and rosiglitazone on insulin-stimulated fuel metabolism of rat soleus muscle strips. Data are given as a percentage of an intraindividual control value (=100%; □) and are means ± SE; n = 6–21 each. *P < 0.05; †P < 0.01; ‡P < 0.001 vs. control.
Effects of TZDs, metformin, and rotenone on cell respiration in isolated muscle. Dose-dependent effects of 24-h exposure to rotenone, metformin, RWJ-241947, pioglitazone, and rosiglitazone on insulin-stimulated fuel metabolism of rat soleus muscle strips. Data are given as a percentage of an intraindividual control value (=100%; □) and are means ± SE; n = 6–21 each. *P < 0.05; †P < 0.01; ‡P < 0.001 vs. control.

The “energy charge hypothesis.” The hypothesis holds that exercise, metformin, and TZDs decrease the cellular energy charge as a result of increased ATP consumption (exercise), complex I–dependent disruption of cell respiration (metformin and TZDs), and/or adipocyte-derived adiponectin (TZDs). Similar effects can be triggered by AICAR, which mimics loss of energy availability by giving rise to the AMP analog ZMP. Changes in the energy charge are known to acutely affect many enzymes (e.g., AMPK), which could contribute to the rapid and delayed metabolic responses common to exercise, TZDs, metformin, and AICAR. Hence, changes in the cellular energy charge could be a unifying early event in the physiological and pharmacological modulation of insulin sensitivity.
The “energy charge hypothesis.” The hypothesis holds that exercise, metformin, and TZDs decrease the cellular energy charge as a result of increased ATP consumption (exercise), complex I–dependent disruption of cell respiration (metformin and TZDs), and/or adipocyte-derived adiponectin (TZDs). Similar effects can be triggered by AICAR, which mimics loss of energy availability by giving rise to the AMP analog ZMP. Changes in the energy charge are known to acutely affect many enzymes (e.g., AMPK), which could contribute to the rapid and delayed metabolic responses common to exercise, TZDs, metformin, and AICAR. Hence, changes in the cellular energy charge could be a unifying early event in the physiological and pharmacological modulation of insulin sensitivity.
Absolute values and variability (indicated by SD) as prevailing under control conditions in the various experimental settings (pooled control data)
| Mean ± SD | n | |
|---|---|---|
| Skeletal muscle homogenates (μmol NADH converted · g tissue−1 · min−1) | 30.47 ± 4.87 | 138 |
| Liver homogenates (μmol NADH converted · g tissue−1 · min−1) | 30.61 ± 7.71 | 115 |
| Isolated mitochondria, glutamate + malate | ||
| State 4 respiration (nmol O · mg protein−1 · min−1) | 18.9 ± 5.9 | 10 |
| State 3 respiration (nmol O · mg protein−1 · min−1) | 79.7 ± 23.2 | 10 |
| Respiratory control | 4.26 ± 0.21 | 10 |
| ADP-to-oxygen ratio (mol/mol) | 2.27 ± 0.15 | 10 |
| Isolated mitochondria, succinate + rotenone | ||
| State 4 respiration (nmol O · mg protein−1 · min−1) | 46.8 ± 9.4 | 10 |
| State 3 respiration (nmol O · mg protein−1 · min−1) | 117.3 ± 22.9 | 10 |
| Respiratory control | 2.52 ± 0.23 | 10 |
| ADP-to-oxygen ratio (mol/mol) | 1.37 ± 0.07 | 10 |
| Soleus muscle strips | ||
| Glucose oxidation (μmol · g−1 · h−1) | 2.38 ± 0.77 | 66 |
| CO2 production from palmitate (nmol · g−1 · h−1) | 115 ± 34 | 39 |
| Lactate release (μmol · g−1 · h−1) | 19.2 ± 3.3 | 45 |
| 3H-2-deoxy-glucose transport (cpm · g−1 · h−1) | 852 ± 196 | 54 |
| Glycogen synthesis (μmol · g−1 · h−1) | 2.79 ± 0.75 | 66 |
| Glycogen content (μmol glucosyl units/g) | 10.7 ± 2.5 | 66 |
Article Information
This work was supported by the Austrian Science Fund (grant no. P16352-B08).
We thank the following companies for generously providing compounds: Sankyo (Tokyo, Japan), Johnson & Johnson (Raritan, NJ), Roche (Basel, Switzerland), Pfizer (Ann Arbor, MI), Yamanouchi (Tsukuba, Japan), Aventis (Frankfurt am Main, Germany), and Viatris (Frankfurt am Main, Germany). We also thank the staff at the Biomedical Research Centre, University of Vienna, for taking care of the rats.