


Abstract
Prostate cancer is one of the most frequent cancer types in Western societies and predominately occurs in the elderly male. The strong age-related increase of prostate cancer is associated with a progressive accumulation of oxidative DNA damage which is presumably supported by a decline of the cellular antioxidative defence during ageing. Risk of developing prostate cancer is much lower in many Asian countries where soy food is an integral part of diet. Therefore, isoflavones from soy were suggested to have chemopreventive activities in prostate cells. Here, we have investigated the hypothesis that the soy-isoflavone genistein could protect DNA of LAPC-4 prostate cells from oxidative stress-related damage by enhancing the expression of antioxidative genes and proteins. A 24 h preincubation with genistein (1–30 μM) protected cells from hydrogen peroxide-induced DNA damage, as determined by the comet assay. Analysis of two cDNA macroarrays, each containing 96 genes of biotransformation and stress response, revealed a modulated expression of 3 genes at 1 μM and of 19 genes at 10 μM genistein. Real-time PCR confirmed the induction of three genes encoding products with antioxidant activities, namely glutathione reductase (2.7-fold), microsomal glutathione S -transferase 1 (1.9-fold) and metallothionein 1X (6.3-fold), at 1–30 μM genistein. 17β-Estradiol, in contrast, decreased the expression of metallothionein 1X at 0.3 μM (2.0-fold), possibly pointing to an estrogen receptor-mediated regulation of this gene. Immunocytochemical staining revealed an induction of metallothionein proteins at 30 μM genistein, while their intracellular localization was unaffected. Metallothioneins were previously found to protect cells from hydrogen peroxide-induced DNA damage. Hence, our findings indicate that genistein protects prostate cells from oxidative stress-related DNA damage presumably by inducing the expression of antioxidative products, such as metallothioneins. Genistein, therefore, might counteract the age-related decline of important antioxidative defence systems which in turn maintain DNA integrity.
Introduction
Prostate cancer is one of the most frequent types of cancer in Western societies. In the USA, lifetime probability for developing invasive prostate cancer was recently estimated to be ∼18% ( 1 ). There is strong evidence for an age-dependency of prostate cancer. While ∼55% of breast tumours develop in women under 65 years of age, only 15% of prostate tumours occur in men up to that age ( 2 ). The age-related increase of prostate cancer risk is closely associated with a progressive accumulation of radical-induced oxidative DNA damage ( 3 ). Radicals are derived from endogenous (mitochondria, cytochrome P450, inflammatory cells and peroxisomes) as well as exogenous sources (redox cycling compounds, metal ions and radiation) ( 4 ). For instance, during mitochondrial oxidative metabolism an estimated 4–5% of the molecular oxygen is converted to radical oxygen species (ROS), primarily to the superoxide anion but also to hydrogen peroxide (H 2 O 2 ) ( 4 ). Various enzymatic antioxidative mechanisms (e.g. superoxide dismutase, catalase and glutathione peroxidase) and also non-enzymatic antioxidative mechanisms (e.g. glutathione, ascorbic acid and α-tocopherol) counterbalance the emergence of these highly reactive species and, therefore, prevent cells from oxidative damage to nucleic acids, lipids and proteins ( 4 ).
During ageing, this redox balance shifts in prostate cells towards a more oxidative state, the so-called oxidative stress, which may in part be due to a decline of antioxidative enzymes like superoxide dismutase and catalase ( 5 , 6 ). Current chemopreventive trials directed at the prevention of prostate cancer involve strategies to neutralize this oxidative stress. It is not surprising that most of the proposed prostate cancer preventive agents like selenium, tocopherols, lycopene or green tea have well known antioxidant activities ( 7 , 8 ). Among these promising candidates are soy and isoflavones from soy ( 9 ).
Soy food is an integral part of the traditional Asian diet and was found to be associated with a lower prostate cancer risk ( 10 , 11 ). Since soy products are outstandingly rich sources of isoflavones, daily isoflavone intake in Asian countries can reach up to 100 mg isoflavone/day ( 12 ), whereas <1 mg/day is consumed in western countries ( 13 ). Likewise, isoflavone concentrations in blood of Asian populations are ∼10 times higher than those of American or European populations ( 14 , 15 ), reaching up to 500 nM for the most abundant isoflavone genistein ( 15 ). However, after supplementation of purified isoflavones, blood concentrations may increase up to 28 μM ( 16 ).
Using the prostate cell line LAPC-4, here we investigated the major isoflavone genistein for its effects on H 2 O 2 -induced DNA damage, proposing that isoflavones act as chemopreventive agents in prostate cells by lowering the age-related oxidative stress and its harmful effects on DNA integrity. Direct antioxidative effects of genistein have been controversially discussed in literature. It was shown to prevent lipid peroxidation in cell-free and cellular systems ( 17–19 ). Data on radical scavenging properties of genistein, however, are inconclusive ( 17 , 20–22 ). In addition, genistein was found to induce expression and activity of the glutathione peroxidase in prostate cells, although high amounts of 100 μM were required ( 23 ). This enzyme decomposes peroxides like H 2 O 2 , preventing the formation of DNA damaging radical species by Fenton reaction ( 24 ). Hence, genistein possibly exerts chemopreventive activities in prostate cells by enhancing antioxidant enzyme systems. We have therefore determined the effects of genistein on the expression of 192 genes involved in biotransformation or stress response. The obtained results were confirmed by real-time PCR and immunocytochemical staining.
Materials and methods
Materials
All media and cell culture supplements were purchased from Gibco (Germany), except charcoal-stripped fetal bovine serum (FBS) (Biological Industries, Israel) and mibolerone (Perkin Elmer Life Sciences, USA). H 2 O 2 and 17β-estradiol were obtained from Sigma (Germany); genistein was purchased from TCI Tokyo Kasai (Japan).
Cell culture
The LAPC-4 prostate carcinoma cell line was a generous gift of Prof. C. L. Sawyers, Department of Medicine, University of California, LA. These cells were derived from a lymph node metastasis of a primary prostate carcinoma and established via a xenograft model ( 25 ). LAPC-4 cells express epithelial antigens, the wild-type androgen receptor and grow androgen-dependently, as reviewed by van Bokhoven et al . ( 26 ). Cells were maintained in Iscove's Modified Dulbecco's Medium supplemented with 10% FBS, 2 mM l -glutamine, 1% penicillin/streptomycin and 2 nM mibolerone. At 24 h prior to compound incubation, the medium was replaced by a phenol red-free media supplemented with 10% charcoal-stripped FBS, 2 mM l -glutamine, 1% penicillin/streptomycin but no mibolerone. Cells were cultured as monolayer and maintained at 37°C at 5% CO 2 and atmosphere of 95% air humidity. For harvesting, cells were incubated with 1% Trypsin/Versen for 3 min, centrifuged and washed with fresh medium.
Comet assay
Cells (2.5 × 10 6 ) were seeded in 25 cm 2 culture flasks. After 48 h, medium was changed as described above. Cells were incubated with 0.01–30 μM genistein for 24 h, harvested and washed with phosphate-buffered saline (PBS). Viability of cells was determined by trypan blue exclusion test using a Neubauer haemocytometer ( 27 ). The comet assay procedure was described previously ( 28 ). In brief, incubated cells were placed on agarose-coated microscopic slides and covered with 0.7% low-melting agarose dissolved in PBS. The oxidative challenge was carried out by dipping these cell-containing slides for 5 min in a 4°C cold bath containing 19 μM H 2 O 2 dissolved in PBS. Slides were then washed with PBS and exposed to a lysis solution (10 mM Tris–HCl, 100 mM Na 2 EDTA, 2.5 M NaCl, 10% DMSO, 1% Triton X-100, pH 10). Subsequently, slides were incubated with alkaline electrophoresis buffer (1 mM Na 2 EDTA, 300 mM NaOH, pH 13) to unwind DNA. Electrophoresis was carried out for 20 min at 25 V and 300 mA. Afterwards, slides were three times washed with neutralization buffer (4.2 M Tris–HCl, 0.08 M Tris–Base, pH 7.2) and DNA was stained with SybrGreen (Sigma, Germany). The rate of DNA stand breaks was measured as percentage DNA in comet tail (tail intensity). Samples were investigated in triplicate. For each slide, 50 cells were evaluated using Axiolab HB50 microscope (Zeiss, Germany), a high performance CCD camera (COHU, USA) and the imaging and analysis system Komet version 4.0 (Kinetic Imaging, UK). The means of three parallel determinations within each experiment were used to calculate the means of at least three independent reproductions.
cDNA macroarray
LAPC-4 cells tend to grow in clusters. Since differences in the growth pattern between the approaches may affect the outcome of gene expression experiments, cells were seeded in a lower density to prevent formation of clusters, although this required an extra day of incubation for the cells to develop their normal shape.
The procedure of cDNA macroarray analysis was described in detail previously ( 29 ). For the current experiments, the total number of 1 × 10 6 cells was seeded in 25 cm 2 culture flasks. After 72 h medium was changed as described above. Cells were incubated with 1 and 10 μM genistein or the respective solvent control 0.1% dimethyl sulfoxide (DMSO) for 24 h and subsequently harvested. RNA was isolated by RNeasy Mini Kit (Qiagen, Germany) and quantified with the Biophotometer (Eppendorf, Germany). cDNA was synthesized from 3 μg total RNA using oligo(dT) primer, amplified and biotinylated by Non-radioactive AmpoLabeling LPR-Kit (SuperArray, USA). Human Drug Metabolism Gene Array (HS-011) and Human Stress & Toxicity PathwayFinder Gene Array (HS-012) from GEArray Q series (SuperArray, USA) were hybridized with the sample probes at 60°C for 16 h, according to the manufacturers protocol. Signals were visualized by Chemiluminescent Detection Kit for GEArrays (SuperArray, USA), imaged using the CCD Camera System LAS-1000/Diana (FujiFilm, Japan) and quantified by the Image Analysis Software AIDA Array Version 3.50 (Raytest, Germany). Thereby, data were corrected for background. Values were normalized, dividing each data point by the mean of all designated housekeeping spots of its respective membrane. All experiments were independently reproduced three times. Significant differences were established by two-tailed unpaired t -test.
Quantitative real-time PCR
The total number of 5 × 10 5 cells was seeded in 6-well plates. After 72 h, the medium was changed as described above. In different experiments cells were incubated with genistein or 17β-estradiol at the indicated concentrations for the indicated time spans (see below). RNA was isolated and quantified as described above. For each sample, cDNA was synthesized from 500 ng RNA by TaqMan Reverse Transcription Reagents (Applied Biosystems, USA) using random hexamer primers. Based on the sequences of the NCBI entries NM_005952.2 (metallothionein 1X, MT-1X), NM_145764.1 (microsomal glutathione S -transferase 1, MGST-1 ) and NM_000637.2 (glutathione reductase, GSR ), primers and VIC/TAMRA labelled probes for TaqMan PCR were designed with the help of the software PrimerDesign 2.0 (Applied Biosystems, USA) as follows: MT-1X (sense, 5′-CTT CTC CTTG CCT CGA AAT GGA-3′; antisense, 5′-AGC AGC AGC TCT TCT TGC AG-3′; probe, 5′-CCC AAC TGC TCC TGC TCG CCT GTT-3′), MGST-1 (sense, 5′-GCC ATC CTG CAC TTC AGA CTA-3′; antisense, 5′-TTC AGC AAC CTG TAA GCC ATG-3′; probe, 5′-TCG GAG CAC GGA TCT ACC ACA CCA-3′) and GSR (sense, 5′-AAT TGG CGT GTT ATT AAG GAA AAG C-3′; antisense, 5′-TCT ATA TGG GAC TTG GTG AGA TTG T-3′; probe 5′-TGC CTA TGT GAG CCG CCT GAA TGC C-3′). Primers were purchased from Invitrogen (UK), probes were from Applied Biosystems (USA). TaqMan real-time PCR was carried out in 96-well plates with the Thermal Cycler GeneAmp 5700 (Applied Biosystems, USA) using TaqMan 2× Universal PCR Master Mix (Applied Biosystems, USA). One plate containing two sets of negative control, serial 1:20 cDNA standard dilutions and the cDNA samples was analysed for one target gene and the Human ACTB Endogenous Control (Applied Biosystems, USA), respectively. All approaches were carried out in duplicate. The applied thermal protocol was 10 min at 95°C and 40 cycles of 15 s and 95°C and 1 min at 60°C. The obtained CT values were evaluated by relative standard curve method and normalized by the respective values of the endogenous control. Finally, treatment with the solvent control (0.1% DMSO) was set to 100% and all samples were calculated accordingly. For these percentage values the term ‘gene expression’ will be used indicating relative changes in gene expression.
Immnunocytochemical analysis
The total number of 1 × 10 5 cells was seeded on cover slip inlays in 6-well plates. After 72 h, medium was changed as described above. Cells were incubated with 0.1% DMSO (solvent control), 50 μM zinc sulphate (positive control), 0.3 μM 17β-estradiol or 1–30 μM genistein for 12 h. Cells were fixed with 4% formaldehyde/PBS overnight at 4°C, permeabilized with methanol for 30 min at room temperature and washed four times with PBS. The analyses were performed using the UltraVision Detection System HRP/DAB (LabVision, USA). In brief, fixed cells were washed four times with PBS and successively incubated with a blocking solution, the 1:50 diluted monoclonal antibody Mouse Anti-Metallothionein E9 (DAKO, Denmark), a biotinylated secondary antibody, a streptavidin-conjugated peroxidase and the chromogen 3,3′-diaminobenzidine hydrochloride (DAB) together with the substrate H 2 O 2 . After each step, cells were washed twice with PBS. Finally, cells were mounted with medium containing 90% glycerol, 9% PBS and 1% of 10 mM butylhydroxytoluol/DMSO. Cover slips with cells were placed on microscopical slides and sealed. For each cover slip, 500 cells were microscopically evaluated for their extent of DAB staining. Cells were allocated to one of three classes (A: no staining; B: intermediate staining; C: intensive staining). Class A cells were weighted with 1 point. Cells of the Classes B and C were weighted double with 2 and 4 points, respectively. The sum of these points per sample was calculated and for this, the term ‘arbitrary expression score’ will be used to indicate changes in the intensity of DAB staining as marker of metallothionein protein expression. In addition, the intracellular localization of metallothioneins was microscopically evaluated and quantified as percentage cells with clear-cut concentrated DAB staining in the cell nucleus (‘nuclear staining’), compared with the total number of evaluated cells.
Results
Modulation of DNA strand breaks and cell viability
Figure 1 shows that a treatment of LAPC-4 cells with genistein for 24 h resulted in a substantially reduced level of H 2 O 2 -induced DNA strand breaks from 22% tail intensity (DMSO pretreated control cells) to 12% (1 and 10 μM genistein) and 10% (30 μM genistein), as determined by the comet assay. Based on this it was possible to calculate a 50% inhibitory concentration (IC 50 ) of 17 μM genistein. Genistein incubation without subsequent H 2 O 2 challenge had no effect on the extent of DNA strand breaks. Here, the tail intensity was within the narrow range of 5–6%. Further, as determined using the trypan blue exclusion test, genistein did not affect cell viability (89–93% vital cells).
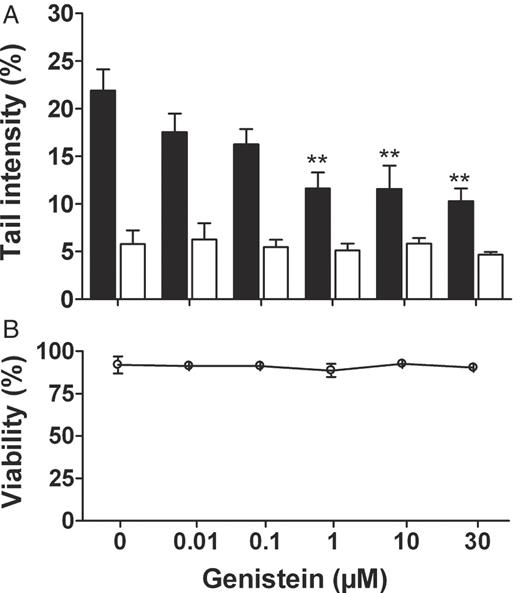
Effects of genistein preincubation on the rate of H 2 O 2 -mediated DNA damage, as determined by the comet assay. LAPC-4 cells were incubated with 0.01–30 μM genistein or the vehicle control 0.1% DMSO for 24 h, trypsinized, washed and subsequently treated for 5 min with either 19 μM H 2 O 2 (black columns) or the respective solvent control PBS (white columns). ( A ) Genistein lowered the rate of H 2 O 2 -mediated DNA damage at 1–30 μM, while it did not affect the rate of DNA damage in unchallenged control cells. Values are means ± SEM of percentage fluorescence in the comet tail (tail intensity). ( B ) Genistein also had no effect on cell viability, as determined by trypan blue exclusion test. *P < 0.05, **P < 0.01 compared to vehicle control (one-way ANOVA, Dunnett's post-test, n = 3).
Modulation of gene expression (cDNA macroarray)
Using the treatment schedule that resulted in the antigenotoxic effects described above, we determined the effects of genistein on the expression levels of 192 genes involved in biotransformation and cellular stress responses. These experiments were performed to assess whether or not the observed antigenotoxic activity of genistein is mediated through a modulation of a subset of these genes. In LAPC-4 cells, genistein at 1 μM downregulated three genes ( Table I ), namely, MYST histone acetyltransferase 2 (1.4-fold, P = 0.008), nicotinamide N-methyltransferase (1.5 fold, P = 0.016) and damage-specific DNA-binding protein 1 (1.3-fold, P = 0.046). In contrast, 10 μM genistein induced 19 genes ( Table II ), including several encoding products known to lower cellular oxidative stress, such as MT-1X (1.3-fold, P = 0.014), MGST-1 (1.5-fold, P = 0.024) and GSR (1.3-fold, P = 0.048). For instance, metallothioneins have been shown to protect DNA from H 2 O 2 -induced strand breaks in Caco-2 cells ( 30 ). Therefore, an induction of MT-1X might have the potential to mediate the protective effects of genistein on oxidative-induced DNA damage in prostate cells. In addition, the induction of MGST-1 , which has peroxidase activity ( 31 ), as well as the induction of GSR , which maintains the level of the intracellular antioxidant glutathione sulfhydryl ( 32 ), may contribute to sustain DNA integrity in prostate cells.
Analysis of gene expression after genistein incubation at 1 μM a
| Name of spot | Control b (mean ± SD) | Treatment (mean ± SD) | Pc | |
|---|---|---|---|---|
| MYST histone acetyltransferase 2 | 72.8 ± 4.6 | 52.4 ± 5.4 | 0.008 | ↓ d |
| Nicotinamide N -methyltransferase | 28.0 ± 2.3 | 19.1 ± 3.1 | 0.016 | ↓ |
| Damage-specific DNA-binding protein 1 | 31.0 ± 3.2 | 24.0 ± 2.8 | 0.046 | ↓ |
a cDNA macroarray analysis (HS-011 and HS-012) in LAPC-4 cells after 24 h genistein incubation at 1 μM (treatment) or 0.1 % DMSO (control).
b Normalized of chemiluminescence of spot signals.
cP -values obtained from two-tailed unpaired t -test comparing treatment and control ( n = 3).
d Direction of effect (↑, upregulation; ↓, downregulation).
Analysis of gene expression after genistein incubation at 10 μM a
| Name of spot | Control b (mean ± SD) | Treatment (mean ± SD) | Pc | |
|---|---|---|---|---|
| Acetyl-coenzyme A acetyltransferase 2 | 244.5 ± 39.6 | 400.8 ± 83.1 | 0.042 | ↑ d |
| Epoxide hydrolase 2, cytoplasmatic | 243.6 ± 12.1 | 306.0 ± 20.1 | 0.010 | ↑ |
| Glutathione S-transferase M3 | 173.1 ± 10.0 | 226.0 ± 27.5 | 0.035 | ↑ |
| Metallothioneine 1X | 168.8 ± 23.1 | 226.5 ± 5.5 | 0.014 | ↑ |
| N -acetyltransferase 5 | 141.7 ± 24.7 | 191.7 ± 16.0 | 0.042 | ↑ |
| Epoxide hydrolase 1, microsomal | 125.1 ± 5.6 | 187.9 ± 15.2 | 0.003 | ↑ |
| Metallothioneine 1L | 122.8 ± 13.6 | 170.5 ± 19.7 | 0.026 | ↑ |
| Glutathione reductase | 111.4 ± 15.3 | 149.5 ± 17.8 | 0.048 | ↑ |
| Microsomal glutathione S -transferase 1 | 101.3 ± 18.0 | 147.1 ± 13.4 | 0.024 | ↑ |
| Caspase 8 | 24.0 ± 2.7 | 38.6 ± 5.7 | 0.016 | ↑ |
| DnaJ (Hsp40) homolog, A1 | 23.5 ± 4.0 | 32.4 ± 3.5 | 0.044 | ↑ |
| Choline acetyltransferase | 22.9 ± 4.7 | 32.1 ± 1.0 | 0.029 | ↑ |
| DNA repair protein XRCC4 | 13.0 ± 0.3 | 15.0 ± 1.5 | 0.032 | ↑ |
| DNA damage-inducible transcript 3 | 10.6 ± 1.2 | 19.1 ± 2.4 | 0.005 | ↑ |
| Heat shock protein (70 kDa) 4 | 8.6 ± 1.0 | 12.6 ± 0.9 | 0.007 | ↑ |
| Prostaglandin endoperoxide synthase 2 (Cox-2) | 7.1 ± 0.6 | 10.0 ± 0.8 | 0.007 | ↑ |
| Tumour necrosis factor alpha (TNF-α) | 3.3 ± 0.5 | 4.8 ± 0.6 | 0.038 | ↑ |
| ATP-binding cassette C1 | 1.6 ± 0.1 | 1.2 ± 0.0 | 0.007 | ↑ |
| ATP-binding cassette B1 | 0.4 ± 0.4 | 1.5 ± 0.3 | 0.015 | ↑ |
a cDNA macroarray analysis (HS-011 and HS-012) in LAPC-4 cells after 24 h genistein incubation at 10 μM (treatment) or 0.1 % DMSO (control).
b Normalized chemiluminescence of spot signals.
cP -values obtained from two-tailed unpaired t -test comparing treatment and control ( n = 3).
d Direction of effect (↑, upregulation; ↓, downregulation).
Modulation of MT-1X, MGST-1 and GSR gene expression (24 h)
To confirm the results of the array screening, we performed quantitative expression analyses using Taqman real-time PCR. In a first experiment, LAPC-4 cells were incubated with either 0.1% DMSO or 0.1–30 μM genistein for 24 h. Genistein at 10 and 30 μM induced the expression of MT-1X by 1.7- and 2.1-fold, respectively ( Figure 2A –C). Genistein at 30 μM also increased the expression of MGST-1 (1.9-fold). In contrast, an induction of GSR was not confirmed.
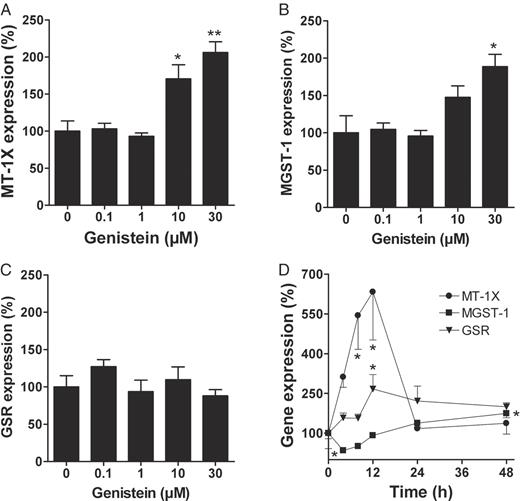
Gene expression analyses of MT-1X, MGST-1 and GSR after genistein incubation, as determined by Taqman real-time PCR. For figures A–C, LAPC-4 cells were incubated with 0.01–30 μM genistein or the vehicle control 0.1% DMSO for 24 h. For figure D, LAPC-4 cells were incubated with 30 μM genistein for 4–48 h, whereas control cells were incubated with 0.1% DMSO (genistein vehicle) for 48 h. ( A ) Genistein at 10 and 30 μM increased MT-1X gene expression by 1.7- and 2.1-fold, respectively. ( B ) Expression of MGST-1 was 1.9-fold induced at 30 μM genistein. ( C ) Expression of GSR , in contrast, was unaffected. ( D ) Expression of MGST-1 had a minimum (2.9-fold depletion) after 4 h but subsequently increased to yield a 1.7-fold induction after 48 h. Expression of MT-1X was induced after 8 h (5.4-fold) and 12 h (6.3-fold). Thereafter, expression declined rapidly to reach control level after 24 h. Expression of GSR had a maximum after 12 h. This expression level, however, declined only slowly. Values are means ± SEM of relative gene expression based on DMSO control (100%). *P < 0.05, **P < 0.01 compared to vehicle control (one-way ANOVA, Dunnett's post-test, n = 3).
Kinetic analysis of the modulation of MT-1X, MGST-1 and GSR gene expression
The second experiment was designed to characterize the time-dependency of gene induction. LAPC-4 cells were incubated with 30 μM genistein for 4, 8, 12, 24 and 48 h. Here, LAPC-4 cells, which had been incubated with 0.1% DMSO for 48 h, served as control. Following the genistein incubation, gene expression of MT-1X clearly increased within 8 h (5.4-fold) and reached a maximum after 12 h (6.3-fold). Thereafter, the expression declined to almost control levels within the next 12 h ( Figure 2D ). In contrast to the first experiment performed after 24 h treatment with genistein, GSR expression was now induced and resulted in a maximum increase after 12 h (2.7-fold). Unlike MT-1X , the level of GSR induction remained almost stable throughout the rest of the experiment. For MGST-1 we observed a 2.9-fold decrease in expression after 4 h. During the remaining course of the experiment, however, the MGST-1 expression increased and finally resulted in a 1.7-fold induction after 48 h.
Modulation of MT-1X gene expression (12 h)
The narrow time frame of the MT-1X induction suggested a reinvestigation of the dose–response relationship between genistein and MT-1X after 12 h incubation. Based on one-way ANOVA and Dunnett's post-test, genistein at 30 μMsignificantly induced MT-1X (3.9-fold) while there was tendency of 1 and 10 μM also to induce gene expression ( Figure 3A ). In this particular case, the ANOVA analysis might have underestimated the effects of 1 and 10 μM, owing to the marked increase at 30 μM. When applying two-tailed unpaired t -tests, these two concentrations also significantly induced the expression of MT-1X (1.4- and 1.7-fold, respectively).
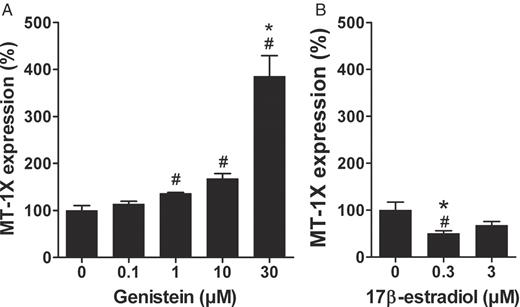
Gene expression analyses of MT-1X after 12 h incubation with genistein or 17β-estradiol, as determined by Taqman real-time PCR. LAPC-4 cells were incubated with either 0.01–30 μM genistein or 0.3 and 3 μM 17β-estradiol. Control cells were incubated with the 0.1% DMSO (genistein vehicle). ( A ) One-way ANOVA analysis revealed induction of MT-1X at 30 μM (3.9-fold). In addition, 1 and 10 μM genistein also slightly increased MT-1X (1.4- and 1.7-fold, respectively) which was only significant in the t -test. ( B ) 17β-estradiol at 0.3 μM decreased MT-1X expression 2.0-fold, whereas 3 μM had no effect. Values are means ± SEM of relative gene expression based on DMSO control (100%). *P < 0.05, compared to vehicle control (one-way ANOVA, Dunnett's post-test, n = 3). #P < 0.05, compared to vehicle control (two-tailed unpaired t -test, n = 3).
Modulation of MT-1X gene expression by 17β-estradiol
To assess whether the genistein-mediated induction of MT-1X was mediated via an estrogen receptor (ER)-mediated mechanism, we also studied the effect of 17β-estradiol. Taking into account the higher affinity of this estrogen to the ER ( 33 , 34 ), we incubated LAPC-4 cells with 17β-estradiol at 10 and 100 times lower concentrations than the most effective genistein concentration (30 μM) for 12 h. Interestingly, 17β-estradiol at 0.3 μM lowered the MT-1X gene expression (2.0-fold) although 17β-estradiol at 3 μM did not alter MT-1X expression ( Figure 3B ).
Modulation of metallothionein protein expression level
With respect to a possible relationship between the sustaining effects on DNA integrity and the induction of metallothionein gene expression, we finally studied whether or not genistein affects the protein level of metallothioneins. We applied an immunocytochemical staining technique using a primary antibody directed against a common epitope of metallothioneins. Thus, we determined the total level of metallothioneins; its induction would refer to a substantial increase of these radical scavenging proteins. Moreover, this technique allows to determine the intracellular localization of metallothioneins, which is of further interest, since a nuclear localization of these proteins was found to be associated with an even higher protection against H 2 O 2 -induced DNA damage ( 30 ). After 12 h incubation, ∼63% of the solvent control cells (0.1% DMSO) showed positive staining as a marker of metallothionein expression. However, only 2% of cells were intensively stained. In contrast, treatment with 10 and 30 μM genistein as well as 50 μM zinc sulphate (positive control) increased the proportion of intensively stained cells to 8, 17 and 35%, respectively. To compare the different treatments, we evaluated 500 cells/sample for their extent of staining and allocated each cell to one of three classes (A, B or C), from ‘not stained’ to ‘intensively stained’. On this basis, we calculated an ‘arbitrary expression score’ (for details see the Materials and methods section) which ranks the protein expression between 500 (no metallothionein expression) and 2000 (high metallothionein expression). The solvent control amounted to 830. Zinc sulphate significantly increased the score to 1299 ( Figure 4 ). Genistein at 1 μM had no effect on the protein level (score: 866). A concentration of 10 μM genistein tended to increase the expression (score: 1046); however, a significant increase was determined at 30 μM (score: 1118). Treatment with 17β-estradiol did not affect the metallothionein protein level (score: 815).
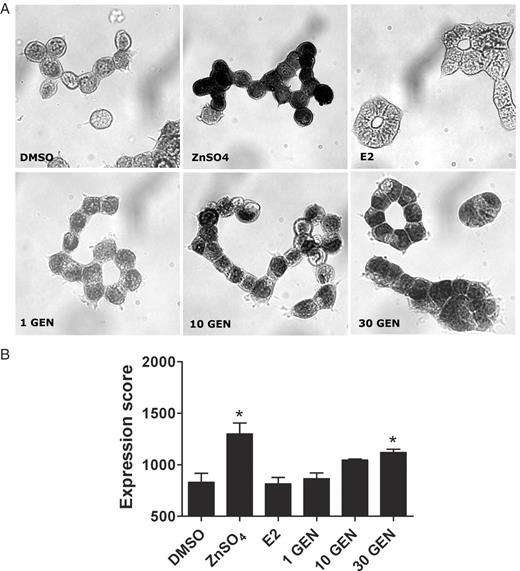
Immunocytochemical analysis of metallothionein protein expression levels after 12 h incubation with various compounds. LAPC-4 cells were incubated with 0.1 % DMSO, 50 μM zinc sulphate (ZnSO 4 ), 0.3 μM 17β-estradiol (E2) or 1–30 μM genistein (GEN) for 12 h. Monochrome images show representative cells, stained following the procedure described in the Materials and methods section. Blackening of cells is indicating the presence of metallothionein protein and appeared orange under the microscope. For each sample, 500 cells were manually evaluated and allocated to three classes according to the intensity of staining. An arbitrary expression score was defined to compare the level of metallothioneins (see the Materials and methods section). Treatment with 50 μM ZnSO 4 and 30 μM genistein significantly increased the expression score from 830 (DMSO) to 1299 and 1118, respectively. Values are means ± SEM of the arbitrary expression score. *P < 0.05, compared to the vehicle control DMSO (one-way ANOVA, Dunnett's post-test, n = 3).
Modulation of intracellular metallothionein localization
Since metallothionein localization within the nucleus is associated with a pronounced protection against oxidative DNA damage, we further determined the proportion of cells with clear-cut concentrated staining of the cell nucleus. About 17% of control cells showed predominant nuclear staining. Neither zinc sulphate nor 17β-estradiol or genistein affected intracellular localization of metallothioneins ( Figure 5 ).
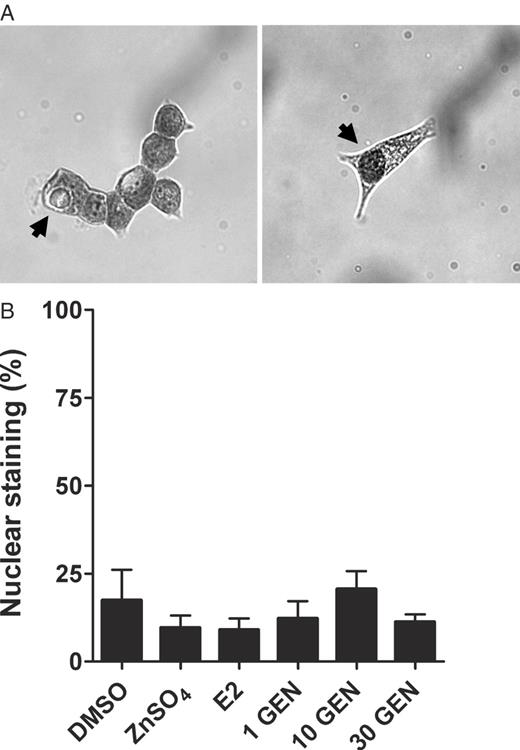
Immunocytochemical analysis of the intracellular localization of metallothioneins after 12 h incubation. LAPC-4 cells were incubated with the 0.1 % DMSO, 50 μM zinc sulphate (ZnSO 4 ), 0.3 μM 17β-estradiol (E2) or 1, 10 or 30 μM genistein (GEN) for 12 h. ( A ) Monochrome images show representative cells stained following the procedure described in the Materials and methods section. Blackening of cells refers to metallothionein protein and originally appeared orange under the microscope. In the right image, the arrow points to a cell with predominant staining of the nucleus. The arrow in the left image points to a cell with predominant staining of the cytoplasm. ( B ) For each sample, 500 cells were manually evaluated for their location of staining. As shown in the graph, treatments did not affect the proportion of cells with predominant staining of the nucleus. Values are means ± SEM of percentage cells which staining of the nucleus exceeded staining of the cytoplasm.
Discussion
Prostate cancer predominately is a disease of the aged male and closely associated with a vast increase of oxidative stress in prostate cells, leading to a progressive accumulation of oxidative DNA damage ( 3 ). Possibly an age-related decline of the cellular antioxidant defence supports or even drives this onset of oxidative stress ( 5 , 6 ). Here, we investigated the effects of the soy-isoflavone genistein on oxidative-induced DNA damage and the expression of antioxidative genes and proteins. Soy products are rich sources of isoflavones and frequently consumed in many Asian countries, where prostate cancer incidence rates are low. Therefore, soy ingredients, and especially the isoflavones, were proposed to have chemopreventive activities in prostate cells which may lower prostate cancer risk.
In the present study we have introduced oxidative stress to our cell models by the endogenous oxidant H 2 O 2 . This approach has successfully been used in numerous previous studies, including our own, to investigate antigenotoxic effects of putative cancer protectants by the comet assay ( 35–39 ). H 2 O 2 induces DNA damage predominately by iron-mediated Fenton reaction via the hydroxyl radical, as reviewed by Henle et al. ( 24 ). By also applying the comet assay, we have demonstrated here that preincubation with genistein for 24 h diminishes the H 2 O 2 -induced DNA strand breaks at 1–30 μM by up to 53%. This genistein treatment did not affect viability of LAPC-4 cells, as determined by trypan blue exclusion test and MTT assay (the latter refers to unpublished data), which demonstrates the absence of cytotoxic effects. In a previous study we have shown that incubation with genistein for 96 h decreases growth of LAPC-4 cells from 20 μM ( 40 ). Thus, in this study at the highest reported antigenotoxic concentration of 30 μM, genistein may also suppress cell growth. The current findings disclose, however, that genistein already at 1 μM protects DNA of prostate cells from oxidative-induced damage. Possibly this is a novel mechanism by which soy-isoflavones act chemopreventive in prostate cells.
Similar activities of genistein were reported in human lymphocytes ( 35 , 38 ) and sperms ( 39 ) in vitro . Moreover, one animal study revealed that a subcutaneous application of 10 μM genistein protects mouse skin cells against H 2 O 2 /UVB-induced DNA in vivo ( 41 ). In a human intervention study with male subjects, supplementation of 100 mg purified soy-isoflavones for 3 weeks lowered the levels of oxidative DNA damage in peripheral lymphocytes by 50%. In the course of this intervention, the genistein plasma concentrations increased up to 2 μM ( 42 ). A second human study supplemented 1 litre soy milk per day for 4 weeks. This intervention elevated the plasma genistein concentrations to 1.3 μM and simultaneously reduced the base levels of oxidative DNA damage in peripheral lymphocytes by ∼60% ( 37 ).
Isoflavones were found to have direct antioxidative activities, e.g. by scavenging free radicals ( 17 , 43 ), although there is controversy about this in literature ( 22 ). Here, we have followed another approach and investigated possible effects on the expression of genes encoding antioxidant products. Based on the results from the comet assay, we incubated LAPC-4 cells for 24 h with the effective antigenotoxic concentrations 1 and 10 μM genistein (achievable in humans by soy-rich diet ( 37 ) and isoflavone supplementation ( 44 ), respectively) and conducted gene expression analysis using cDNA macroarrays. Genistein at 10 μM indeed induced three antioxidant genes which might be involved in the protection from H 2 O 2 -mediated DNA damage, namely GSR, MGST-1 and MT-1X .
We performed real-time PCR to verify these results. Using the full physiological concentration range of up to 30 μM genistein ( 16 ), we confirmed the inductions of MGST-1 (30 μM) and MT-1X (10 and 30 μM). At this stage of the study, however, we did not find further support for an induction of GSR. The following experiments investigated the time kinetics of gene regulations at 30 μM genistein, since this concentration had previously been most active in terms of target gene induction. Expression of MT-1X and GSR had a significant peak after 12 h. Expression of MGST-1 , in contrast, decreased after 4 h but subsequently increased to yield an induction after 48 h. Hence, this set of experiments confirmed that genistein induces these three genes. None of the inductions, however, was significant after 24 h, which seems to contradict the previous results. The lack of significance may in part be due to the higher biological variances within the time kinetics study, especially in the case of MT-1X where this discrepancy is most evident. Further, the experiments depended on one another and had to be performed successively. Therefore, we had to use different cell batches which could have affected the outcome too. This may also account for the fact that the time kinetics study ( Figure 2D ) and the subsequently conducted experiment on dose-dependency differed in their magnitudes of MT-1X induction after 12 h genistein incubation ( Figure 3A ). Taken together, the results nonetheless allow to conclude that genistein induces the expression of MT-1X, MGST-1 and probably GSR .
The GSR regenerates the important endogenous antioxidant glutathione sulfhydryl (GSH) after its oxidation to glutathione disulfide (GSSG). GSR, therefore, is directly involved in the maintenance of a physiological GSH level which is crucial for the intracellular redox homeostasis ( 32 ). GSH is not only a co-substrate of antioxidative enzymes like glutathione peroxidases or glutathione S -transferases but also directly quenches free radicals like the hydroxyl radical ( 45 ). The MGST-1 is a membrane-associated member of the glutathione S -transferase family exerting peroxidase activity and, therefore, catalyses the detoxification of peroxides before they form more reactive species. Predominately, microsomal glutathione S -transferases seem to inactivate lipid peroxides within membranes ( 31 ). MT-1X is a proteinogenic isoform of metallothioneins, which are small proteins with ∼60 amino acids (<7000 Da) and 18–23 highly conserved cysteine residues. According to GSH, the sulfhydryl groups of these cysteine residues have substantial redox properties ( 46 ). Metallothioneins bind heavy metal ions and other ions capable of catalyzing Fenton reaction. ( 47 ). They are very efficient in quenching superoxide or hydroxyl radicals and protect GSH from oxidation ( 45 ). Moreover, overexpression of metallothioneins was shown to protect CHO cells from H 2 O 2 -induced DNA damage ( 30 ). Thus, our results may indicate that genistein protects DNA of prostate cells by enhancing the cellular antioxidative defence. The induction of antioxidant genes required genistein concentrations that were somewhat higher than those reached after dietary soy intake ( 37 ), although such levels can be achieved by supplementing with purified isoflavones ( 16 ). Our results, therefore, are probably physiological relevant. From a mechanistic point of view, the induction of metallothioneins might have the strongest potential to mediate the observed protective effects of genistein on DNA integrity in prostate cells. For this reason and since genistein induced MT-1X most clear-cut, we have investigated the regulation of this gene in more detail.
Unlike genistein, 17β-estadiol at 0.3 μM had a downregulating effect on MT-1X expression. Cytotoxic events are unlikely to account for this effect, since we have demonstrated previously that the estrogen, under comparable culture conditions, does not affect LAPC-4 cell growth at up to 10 μM ( 40 ). In conclusion, one may propose that genistein and 17β-estadiol modulate MT-1X by an ER-dependent mechanism. The promoter regions of metallothionein 1 isoforms, however, were found to contain only a number of metal response elements (MREs) and GC-boxes but no estrogen response elements (EREs) ( 48 ). But not all ER-mediated activities require classical EREs, and genistein was already reported to induce the gene expression of the metallothionein isoform 2A via the GC-box (Sp1 binding site), which was even more pronounced when ERβ was overexpressed ( 49 ). This indicates that the induction of MT-1X in LAPC-4 prostate cells, as seen in the present study, is likely to be also mediated through ERβ and the Sp1 binding site.
Saville et al. ( 50 ) published a putative model of this novel ER-dependent signal pathway. These authors revealed that Sp1 associates with both ER isoforms and binds to a GC-box. Upon ligand binding, the ER undergoes conformational changes which either allows or does not allow co-activators or general transcription factors to bind and to form a transcriptionally active complex ( 50 ). In that article, 17β-estadiol suppressed the GC-box-mediated transcriptional activation in ERβ overexpressing LNCaP prostate cells. Similarly, we have observed a downregulation of MT-1X by 17β-estadiol in LAPC-4 cells. Since epithelial prostate cells predominately express ERβ ( 51 ), the estrogen possibly suppresses the transcription of ERβ/Sp1-regulated genes like metallothioneins in prostate cells, while the phytoestrogen genistein acts in an opposite manner. However, more specific studies will be needed to support this proposal. In addition, such studies should include the two other herein disclosed antioxidant target genes, MGST-1 and GSR , in order to clarify whether or not these genes are regulated by the same mechanism.
We also investigated metallothioneins at protein level. For this purpose we used an antibody directed against a common metallothionein epitope which allowed the detection of metallothioneins in general. Here, genistein induced metallothioneins in LAPC-4 cells at 30 μM. Furthermore, there was an insignificant tendency to increase metallothionein proteins at 10 μM genistein. 17β-Estadiol, in contrast, did not affect metallothionein protein expression. The observed effect of genistein on metallothionein protein level is likely to be substantial, since the total level was affected here. Thus, the increase of metallothioneins probably improves the antioxidant defence of prostate cells. Whether or not this induction is indeed capable of lowering oxidative stress-induced DNA damage needs further investigation.
While genistein induced the level of metallothionein protein, it did not alter the intracellular localization, as determined by the visible proportion of cells with predominant nuclear concentration of metallothioneins. Previously, nuclear localization of these proteins, e.g. in the S-phase of cell cycle, has been found to even better protect DNA from H 2 O 2 -induced damage than a localization in the cytoplasm ( 30 ).
In conclusion, the soy-isoflavone genistein protects LAPC-4 prostate cells against oxidative-induced DNA damage, as it occurs in the prostate of aged men. Since progressive oxidative DNA damage lowers DNA integrity and might be involved in the initiation or progression of prostate cancer, the antigenotoxic effects of genistein may reflect a novel chemopreventive activity. Genistein possibly exerts this activity by inducing antioxidative enzymes and related proteins. For the first time, here we have shown that genistein at physiological concentrations enhances the transcription of MGST-1 and GSR in prostate cells. Moreover, genistein induced the gene expression of MT-1X at 1–30 μM as well as the total metallothionein protein expression at 30 μM. These inductions are possibly mediated through an ERE-independent pathway via ERβ/SP1. Additional investigations are necessary to prove this proposed pathway and to directly relate these observations to a protection against oxidative-induced DNA damage.
In conclusion, our novel findings support the proposed chemopreventive properties of genistein in prostate cells and point to indirect antioxidative activities, e.g. by restoring the cellular antioxidative defence during ageing. These mechanisms might also be part of the proposed cancer risk-lowering effects of the traditional soy-based Asian diet.
Abbreviations
-
DAB
3,3′-diaminobenzidine hydrochloride
-
ER
estrogen receptor
-
GSR
glutathione reductase
-
MGST-1
microsomal glutathione S -transferase
-
MT-1X
metallothioneine 1X
The authors wish to thank Prof. Charles L. Sawyers (University of California, USA) who kindly provided the LAPC-4 cells. This study was carried out with financial support from the Commission of the European Communities specific RTD programme ‘Quality of Life and Management of Living Resources’ (project no. QLK-2000-00266) as well as with Marie Curie Development Host Fellowship (project no. HPMT-CT-2001-00287) also from the Commission of the European Communities programme.
Conflict of Interest Statement : The study does not necessarily reflect the Commission's views and in no way anticipates its future policy in this area.
