
NPC1 Confers Metabolic Flexibility in Triple Negative Breast Cancer

 ,
,
,
,
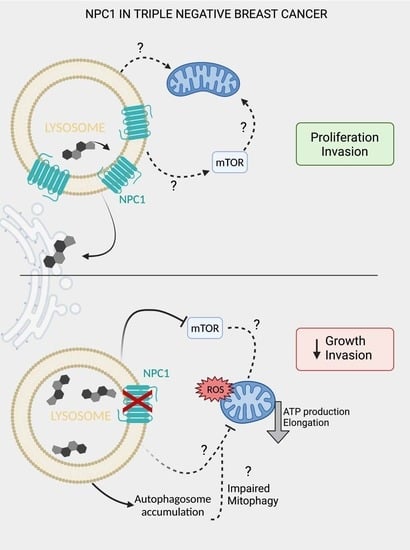
Abstract
:Simple Summary
Abstract
1. Introduction
2. Methods
2.1. Cell Culture and Reagents
Stable NPC1 Knockdown and Exogenous Expression Cell Lines
2.2. Transfections
2.3. qRT-PCR
2.4. Immunoblotting
2.5. Nutrient Deprivation
2.6. Dil-LDL Uptake
2.7. Two-Dimensional and Three-Dimensional Growth and Invasion Assays
2.8. Invasion Assay
2.9. Microscopy
Mitochondrial Immunocytochemistry and Quantification
2.10. Filipin Stain
2.11. NPC1 IHC
2.12. Mitochondrial Assay
2.13. Mitochondrial Reactive Oxygen Species
2.14. Bioinformatics and Pathway Analysis
2.14.1. miR200c Gene Array Pathway Analysis
2.14.2. Auxotrophy Correlation
3. Results
3.1. NPC1 Is Significantly Elevated in TNBC and Is Directly Targeted by miR-200c
3.2. NPC1 Supports Breast Cancer Cell Invasion and Growth in Soft Agar
3.3. TNBC Cells Are Cholesterol Auxotrophs, but Do Not Solely Depend on NPC1 for Adequate Cholesterol Supply
3.4. NPC1 Supports Mitochondrial Respiration and Maintains Mitochondrial Morphology
3.5. NPC1 Affects mTOR and Autophagy Signaling under Stress Conditions in TNBC
3.6. NPC1 Has Therapeutic Potential Alone and in Combination with Chemotherapy in TNBC
4. Discussion
5. Conclusions
Supplementary Materials
Author Contributions
Funding
Institutional Review Board Statement
Informed Consent Statement
Data Availability Statement
Acknowledgments
Conflicts of Interest
References
- Abramson, V.G.; Lehmann, B.D.; Ballinger, T.J.; Pietenpol, J.A. Subtyping of triple-negative breast cancer: Implications for therapy. Cancer 2015, 121, 8–16. [Google Scholar] [CrossRef] [PubMed] [Green Version]
- Liedtke, C.; Mazouni, C.; Hess, K.R.; André, F.; Tordai, A.; Mejia, J.A.; Symmans, W.F.; Gonzalez-Angulo, A.M.; Hennessy, B.; Green, M.; et al. Response to Neoadjuvant Therapy and Long-Term Survival in Patients with Triple-Negative Breast Cancer. J. Clin. Oncol. 2008, 26, 1275–1281. [Google Scholar] [CrossRef] [PubMed]
- Cochrane, D.R.; Cittelly, D.M.; Howe, E.N.; Spoelstra, N.S.; McKinsey, E.L.; LaPara, K.; Elias, A.; Yee, D.; Richer, J.K. MicroRNAs Link Estrogen Receptor Alpha Status and Dicer Levels in Breast Cancer. Horm. Cancer 2010, 1, 306–319. [Google Scholar] [CrossRef] [PubMed] [Green Version]
- Feng, Z.-M.; Qiu, J.; Chen, X.-W.; Liao, R.-X.; Liao, X.-Y.; Zhang, L.-P.; Chen, X.; Li, Y.; Chen, Z.-T.; Sun, J.-G. Essential role of miR-200c in regulating self-renewal of breast cancer stem cells and their counterparts of mammary epithelium. BMC Cancer 2015, 15, 645. [Google Scholar] [CrossRef] [PubMed] [Green Version]
- Lim, Y.-Y.; Wright, J.A.; Attema, J.L.; Gregory, P.A.; Bert, A.G.; Smith, E.; Thomas, D.; Lopez, A.F.; Drew, P.A.; Khew-Goodall, Y.; et al. Epigenetic modulation of the miR-200 family is associated with transition to a breast cancer stem-cell-like state. J. Cell Sci. 2013, 126, 2256–2266. [Google Scholar] [CrossRef] [Green Version]
- Howe, E.N.; Cochrane, D.R.; Richer, J.K. Targets of miR-200c mediate suppression of cell motility and anoikis resistance. Breast Cancer Res. 2011, 13, R45. [Google Scholar] [CrossRef] [Green Version]
- Burk, U.; Schubert, J.; Wellner, U.; Schmalhofer, O.; Vincan, E.; Spaderna, S.; Brabletz, T. A reciprocal repression between ZEB1 and members of the miR-200 family promotes EMT and invasion in cancer cells. EMBO Rep. 2008, 9, 582–589. [Google Scholar] [CrossRef] [Green Version]
- Kawaguchi, T.; Yan, L.; Qi, Q.; Peng, X.; Gabriel, E.M.; Young, J.; Liu, S.; Takabe, K. Overexpression of suppressive microRNAs, miR-30a and miR-200c are associated with improved survival of breast cancer patients. Sci. Rep. 2017, 7, 15945. [Google Scholar] [CrossRef] [Green Version]
- Kalluri, R.; Weinberg, R.A. The basics of epithelial-mesenchymal transition. J. Clin. Investig. 2009, 119, 1420–1428. [Google Scholar] [CrossRef] [Green Version]
- Mak, M.P.; Tong, P.; Diao, L.; Cardnell, R.J.; Gibbons, D.L.; William, W.N.; Skoulidis, F.; Parra, E.R.; Rodriguez-Canales, J.; Wistuba, I.I.; et al. A Patient-Derived, Pan-Cancer EMT Signature Identifies Global Molecular Alterations and Immune Target Enrichment Following Epithelial-to-Mesenchymal Transition. Clin. Cancer Res. 2016, 22, 609–620. [Google Scholar] [CrossRef] [Green Version]
- Polytarchou, C.; Iliopoulos, D.; Struhl, K. An integrated transcriptional regulatory circuit that reinforces the breast cancer stem cell state. Proc. Natl. Acad. Sci. USA 2012, 109, 14470–14475. [Google Scholar] [CrossRef] [PubMed] [Green Version]
- Rogers, T.J.; Christenson, J.L.; Greene, L.I.; Neill, K.I.; Williams, M.M.; Gordon, M.A.; Nemkov, T.; Alessandro, A.; DeGala, G.D.; Shin, J.; et al. Reversal of Triple-negative Breast Cancer EMT by miR-200c Decreases Tryptophan Catabolism and a Program of Immune-Suppression. Mol. Cancer Res. 2019, 17, 30–41. [Google Scholar] [CrossRef] [PubMed] [Green Version]
- Williams, M.M.; Hafeez, S.A.; Christenson, J.L.; O’Neill, K.I.; Hammond, N.G.; Richer, J.K. Reversing an Oncogenic Epithelial-to-Mesenchymal Transition Program in Breast Cancer Reveals Actionable Immune Suppressive Pathways. Pharmaceuticals 2021, 14, 1122. [Google Scholar] [CrossRef] [PubMed]
- Goldstein, J.L.; Brown, M.S. A century of cholesterol and coronaries: From plaques to genes to statins. Cell 2015, 161, 161–172. [Google Scholar] [CrossRef] [Green Version]
- Li, X.; Wang, J.; Coutavas, E.; Shi, H.; Hao, Q.; Blobel, G. Structure of human Niemann–Pick C1 protein. Proc. Natl. Acad. Sci. USA 2016, 113, 8212–8217. [Google Scholar] [CrossRef] [Green Version]
- Kennedy, B.E.; Madreiter, C.T.; Vishnu, N.; Malli, R.; Graier, W.F.; Karten, B. Adaptations of energy metabolism associated with increased levels of mitochondrial cholesterol in Niemann-Pick type C1-deficient cells. J. Biol. Chem. 2014, 289, 16278–16289. [Google Scholar] [CrossRef] [Green Version]
- Geberhiwot, T.; Moro, A.; Dardis, A.; Ramaswami, U.; Sirrs, S.; Marfa, M.P.; Vanier, M.T.; Walterfang, M.; Bolton, S.; Dawson, C.; et al. Consensus clinical management guidelines for Niemann-Pick disease type C. Orphanet J. Rare Dis. 2018, 13, 50. [Google Scholar] [CrossRef] [Green Version]
- Castellano, B.M.; Thelen, A.M.; Moldavski, O.; Feltes, M.; van der Welle, R.E.N.; Mydock-McGrane, L.; Jiang, X.; van Eijkeren, R.J.; Davis, O.B.; Louie, S.M.; et al. Lysosomal cholesterol activates mTORC1 via an SLC38A9–Niemann-Pick C1 signaling complex. Science 2017, 355, 1306–1311. [Google Scholar] [CrossRef] [Green Version]
- Lim, C.-Y.; Davis, O.B.; Shin, H.R.; Zhang, J.; Berdan, C.A.; Jiang, X.; Counihan, J.L.; Ory, D.S.; Nomura, D.K.; Zoncu, R. ER–lysosome contacts enable cholesterol sensing by mTORC1 and drive aberrant growth signalling in Niemann–Pick type C. Nat. Cell Biol. 2019, 21, 1206–1218. [Google Scholar] [CrossRef]
- Nam, J.W.; Rissland, O.S.; Koppstein, D.; Abreu-Goodger, C.; Jan, C.H.; Agarwal, V.; Yildirim, M.A.; Rodriguez, A.; Bartel, D.P. Global analyses of the effect of different cellular contexts on microRNA targeting. Mol. Cell 2014, 53, 1031–1043. [Google Scholar] [CrossRef] [Green Version]
- Gévry, N.; Schoonjans, K.; Guay, F.; Murphy, B.D. Cholesterol supply and SREBPs modulate transcription of the Niemann-Pick C-1 gene in steroidogenic tissues. J. Lipid Res. 2008, 49, 1024–1033. [Google Scholar] [CrossRef] [PubMed] [Green Version]
- Garver, W.S.; Jelinek, D.; Francis, G.A.; Murphy, B.D. The Niemann-Pick C1 gene is downregulated by feedback inhibition of the SREBP pathway in human fibroblasts. J. Lipid Res. 2008, 49, 1090–1102. [Google Scholar] [CrossRef] [PubMed] [Green Version]
- Gévry, N.Y.; Lalli, E.; Sassone-Corsi, P.; Murphy, B.D. Regulation of Niemann-Pick C1 Gene Expression by the 3′5′-Cyclic Adenosine Monophosphate Pathway in Steroidogenic Cells. Mol. Endocrinol. 2003, 17, 704–715. [Google Scholar] [CrossRef] [PubMed]
- Jose, J.; Hoque, M.; Engel, J.; Beevi, S.S.; Wahba, M.; Georgieva, M.I.; Murphy, K.J.; Hughes, W.E.; Cochran, B.J.; Lu, A.; et al. Annexin A6 and NPC1 regulate LDL-inducible cell migration and distribution of focal adhesions. Sci. Rep. 2022, 12, 596. [Google Scholar] [CrossRef] [PubMed]
- Das, A.; Brown, M.S.; Anderson, D.D.; Goldstein, J.L.; Radhakrishnan, A. Three pools of plasma membrane cholesterol and their relation to cholesterol homeostasis. Elife 2014, 3, E02882. [Google Scholar] [CrossRef]
- Nieweg, K.; Schaller, H.; Pfrieger, F.W. Marked differences in cholesterol synthesis between neurons and glial cells from postnatal rats. J. Neurochem. 2009, 109, 125–134. [Google Scholar] [CrossRef]
- Garcia-Bermudez, J.; Baudrier, L.; Bayraktar, E.C.; Shen, Y.; La, K.; Guarecuco, R.; Yucel, B.; Fiore, D.; Tavora, B.; Freinkman, E.; et al. Squalene accumulation in cholesterol auxotrophic lymphomas prevents oxidative cell death. Nature 2019, 567, 118–122. [Google Scholar] [CrossRef]
- Riscal, R.; Bull, C.J.; Mesaros, C.; Finan, J.M.; Carens, M.; Ho, E.S.; Xu, J.P.; Godfrey, J.; Brennan, P.; Johansson, M.; et al. Cholesterol Auxotrophy as a Targetable Vulnerability in Clear Cell Renal Cell Carcinoma. Cancer Discov. 2021, 11, 3106. [Google Scholar] [CrossRef]
- Abi-Mosleh, L.; Infante Rodney, E.; Radhakrishnan, A.; Goldstein Joseph, L.; Brown Michael, S. Cyclodextrin overcomes deficient lysosome-to-endoplasmic reticulum transport of cholesterol in Niemann-Pick type C cells. Proc. Natl. Acad. Sci. USA 2009, 106, 19316–19321. [Google Scholar] [CrossRef] [Green Version]
- Brogden, G.; Shammas, H.; Walters, F.; Maalouf, K.; Das, A.M.; Naim, H.Y.; Rizk, S. Different Trafficking Phenotypes of Niemann-Pick C1 Gene Mutations Correlate with Various Alterations in Lipid Storage, Membrane Composition and Miglustat Amenability. Int. J. Mol. Sci. 2020, 21, 2101. [Google Scholar] [CrossRef] [Green Version]
- Frolov, A.; Zielinski, S.E.; Crowley, J.R.; Dudley-Rucker, N.; Schaffer, J.E.; Ory, D.S. NPC1 and NPC2 Regulate Cellular Cholesterol Homeostasis through Generation of Low Density Lipoprotein Cholesterol-derived Oxysterols*. J. Biol. Chem. 2003, 278, 25517–25525. [Google Scholar] [CrossRef] [PubMed] [Green Version]
- DeBose-Boyd, R.A.; Ye, J. SREBPs in Lipid Metabolism, Insulin Signaling, and Beyond. Trends Biochem. Sci. 2018, 43, 358–368. [Google Scholar] [CrossRef] [PubMed]
- Wei, J.; Zhang, Y.Y.; Luo, J.; Wang, J.Q.; Zhou, Y.X.; Miao, H.H.; Shi, X.J.; Qu, Y.X.; Xu, J.; Li, B.L.; et al. The GARP Complex Is Involved in Intracellular Cholesterol Transport via Targeting NPC2 to Lysosomes. Cell Rep. 2017, 19, 2823–2835. [Google Scholar] [CrossRef] [Green Version]
- Naito, T.; Ercan, B.; Krshnan, L.; Triebl, A.; Koh, D.H.Z.; Wei, F.-Y.; Tomizawa, K.; Torta, F.T.; Wenk, M.R.; Saheki, Y. Movement of accessible plasma membrane cholesterol by the GRAMD1 lipid transfer protein complex. Elife 2019, 8, e51401. [Google Scholar] [CrossRef] [PubMed]
- Davis, O.B.; Shin, H.R.; Lim, C.Y.; Wu, E.Y.; Kukurugya, M.; Maher, C.F.; Perera, R.M.; Ordonez, M.P.; Zoncu, R. NPC1-mTORC1 Signaling Couples Cholesterol Sensing to Organelle Homeostasis and Is a Targetable Pathway in Niemann-Pick Type C. Dev. Cell 2021, 56, 260–276.e267. [Google Scholar] [CrossRef] [PubMed]
- Yambire, K.F.; Fernandez-Mosquera, L.; Steinfeld, R.; Mühle, C.; Ikonen, E.; Milosevic, I.; Raimundo, N. Mitochondrial biogenesis is transcriptionally repressed in lysosomal lipid storage diseases. Elife 2019, 8, e39598. [Google Scholar] [CrossRef]
- Sundqvist, M.; Christenson, K.; Björnsdottir, H.; Osla, V.; Karlsson, A.; Dahlgren, C.; Speert, D.P.; Fasth, A.; Brown, K.L.; Bylund, J. Elevated Mitochondrial Reactive Oxygen Species and Cellular Redox Imbalance in Human NADPH-Oxidase-Deficient Phagocytes. Front. Immunol. 2017, 8, 1828. [Google Scholar] [CrossRef] [Green Version]
- Long, Q.; Zhao, D.; Fan, W.; Yang, L.; Zhou, Y.; Qi, J.; Wang, X.; Liu, X. Modeling of Mitochondrial Donut Formation. Biophys. J. 2015, 109, 892–899. [Google Scholar] [CrossRef] [Green Version]
- Miyazono, Y.; Hirashima, S.; Ishihara, N.; Kusukawa, J.; Nakamura, K.-i.; Ohta, K. Uncoupled mitochondria quickly shorten along their long axis to form indented spheroids, instead of rings, in a fission-independent manner. Sci. Rep. 2018, 8, 350. [Google Scholar] [CrossRef] [Green Version]
- Picard, M.; McEwen Bruce, S. Mitochondria impact brain function and cognition. Proc. Natl. Acad. Sci. USA 2014, 111, 7–8. [Google Scholar] [CrossRef] [Green Version]
- Caino, M.C.; Altieri, D.C. Molecular Pathways: Mitochondrial Reprogramming in Tumor Progression and Therapy. Clin. Cancer Res. Off. J. Am. Assoc. Cancer Res. 2016, 22, 540–545. [Google Scholar] [CrossRef] [PubMed] [Green Version]
- Shah, S.P.; Roth, A.; Goya, R.; Oloumi, A.; Ha, G.; Zhao, Y.; Turashvili, G.; Ding, J.; Tse, K.; Haffari, G.; et al. The clonal and mutational evolution spectrum of primary triple-negative breast cancers. Nature 2012, 486, 395–399. [Google Scholar] [CrossRef] [PubMed]
- Lu, F.; Liang, Q.; Abi-Mosleh, L.; Das, A.; De Brabander, J.K.; Goldstein, J.L.; Brown, M.S. Identification of NPC1 as the target of U18666A, an inhibitor of lysosomal cholesterol export and Ebola infection. Elife 2015, 4, e12177. [Google Scholar] [CrossRef] [PubMed]
- Quan, X.; Chen, X.; Sun, D.; Xu, B.; Zhao, L.; Shi, X.; Liu, H.; Gao, B.; Lu, X. The mechanism of the effect of U18666a on blocking the activity of 3β-hydroxysterol Δ-24-reductase (DHCR24): Molecular dynamics simulation study and free energy analysis. J. Mol. Modeling 2016, 22, 46. [Google Scholar] [CrossRef]
- Ianevski, A.; Giri, A.K.; Aittokallio, T. SynergyFinder 2.0: Visual analytics of multi-drug combination synergies. Nucleic Acids Res. 2020, 48, W488–W493. [Google Scholar] [CrossRef]
- Dongre, A.; Weinberg, R.A. New insights into the mechanisms of epithelial–mesenchymal transition and implications for cancer. Nat. Rev. Mol. Cell Biol. 2019, 20, 69–84. [Google Scholar] [CrossRef]
- Head, S.A.; Shi, W.Q.; Yang, E.J.; Nacev, B.A.; Hong, S.Y.; Pasunooti, K.K.; Li, R.-J.; Shim, J.S.; Liu, J.O. Simultaneous Targeting of NPC1 and VDAC1 by Itraconazole Leads to Synergistic Inhibition of mTOR Signaling and Angiogenesis. ACS Chem. Biol. 2017, 12, 174–182. [Google Scholar] [CrossRef]
- Lyu, J.; Yang, E.J.; Head, S.A.; Ai, N.; Zhang, B.; Wu, C.; Li, R.J.; Liu, Y.; Yang, C.; Dang, Y.; et al. Pharmacological blockade of cholesterol trafficking by cepharanthine in endothelial cells suppresses angiogenesis and tumor growth. Cancer Lett. 2017, 409, 91–103. [Google Scholar] [CrossRef]
- Höglinger, D.; Burgoyne, T.; Sanchez-Heras, E.; Hartwig, P.; Colaco, A.; Newton, J.; Futter, C.E.; Spiegel, S.; Platt, F.M.; Eden, E.R. NPC1 regulates ER contacts with endocytic organelles to mediate cholesterol egress. Nat. Commun. 2019, 10, 4276. [Google Scholar] [CrossRef] [Green Version]
- Westermann, B. Mitochondrial fusion and fission in cell life and death. Nat. Rev. Mol. Cell Biol. 2010, 11, 872–884. [Google Scholar] [CrossRef]
- Boulton, D.P.; Caino, M.C. Mitochondrial Fission and Fusion in Tumor Progression to Metastasis. Front. Cell Dev. Biol. 2022, 10. [Google Scholar] [CrossRef] [PubMed]
- Trotta, A.P.; Chipuk, J.E. Mitochondrial dynamics as regulators of cancer biology. Cell. Mol. Life Sci. 2017, 74, 1999–2017. [Google Scholar] [CrossRef] [PubMed]
- Liu, X.; Hajnóczky, G. Altered fusion dynamics underlie unique morphological changes in mitochondria during hypoxia–reoxygenation stress. Cell Death Differ. 2011, 18, 1561–1572. [Google Scholar] [CrossRef] [PubMed] [Green Version]
- Yu, W.; Gong, J.-S.; Ko, M.; Garver, W.S.; Yanagisawa, K.; Michikawa, M. Altered Cholesterol Metabolism in Niemann-Pick Type C1 Mouse Brains Affects Mitochondrial Function. J. Biol. Chem. 2005, 280, 11731–11739. [Google Scholar] [CrossRef] [PubMed] [Green Version]
- Charman, M.; Kennedy, B.E.; Osborne, N.; Karten, B. MLN64 mediates egress of cholesterol from endosomes to mitochondria in the absence of functional Niemann-Pick Type C1 protein. J. Lipid Res. 2010, 51, 1023–1034. [Google Scholar] [CrossRef] [Green Version]


|
Publisher’s Note: MDPI stays neutral with regard to jurisdictional claims in published maps and institutional affiliations.
|
© 2022 by the authors. Licensee MDPI, Basel, Switzerland. This article is an open access article distributed under the terms and conditions of the Creative Commons Attribution (CC BY) license (https://creativecommons.org/licenses/by/4.0/).
Share and Cite
O’Neill, K.I.; Kuo, L.-W.; Williams, M.M.; Lind, H.; Crump, L.S.; Hammond, N.G.; Spoelstra, N.S.; Caino, M.C.; Richer, J.K. NPC1 Confers Metabolic Flexibility in Triple Negative Breast Cancer. Cancers 2022, 14, 3543. https://doi.org/10.3390/cancers14143543
O’Neill KI, Kuo L-W, Williams MM, Lind H, Crump LS, Hammond NG, Spoelstra NS, Caino MC, Richer JK. NPC1 Confers Metabolic Flexibility in Triple Negative Breast Cancer. Cancers. 2022; 14(14):3543. https://doi.org/10.3390/cancers14143543
Chicago/Turabian StyleO’Neill, Kathleen I., Li-Wei Kuo, Michelle M. Williams, Hanne Lind, Lyndsey S. Crump, Nia G. Hammond, Nicole S. Spoelstra, M. Cecilia Caino, and Jennifer K. Richer. 2022. "NPC1 Confers Metabolic Flexibility in Triple Negative Breast Cancer" Cancers 14, no. 14: 3543. https://doi.org/10.3390/cancers14143543