


Abstract
Few data are available examining the determinants of vitamin D status exclusively in older adults. We aimed to investigate the prevalence and determinants of vitamin D deficiency in a representative sample of the older Irish population (aged 50–98 years).
The concentration of 25-hydroxyvitamin D (25(OH)D) was measured in 5,356 community-dwelling older Irish adults from The Irish Longitudinal Study on Ageing (TILDA). Detailed demographic, geographic, lifestyle, and socioeconomic factors were assessed by questionnaire. Proportions of deficiency prevalence were generated by season sampled. Linear regression was used to investigate the association between 25(OH)D concentration and reported risk factors.
The prevalence of deficiency (25(OH)D < 30 nmol/L) was 13.1% (95% CI: 12.1–14.2). Deficiency status was more prevalent in nonsupplement users, in winter, in smokers, in obese adults, the physically inactive, those living alone, and in the oldest old (>80 years). The main predictors (p < .05) of 25(OH)D concentration were supplement use (coefficient nmol/L: 27.2 [95% CI: 15.3–39.2]), smoking (−8.9 [−12.6–−5.2]), summer season (5.9 [2.7–9.1]), and obesity (−4.0 [−6.3–−1.7]).
Vitamin D deficiency is common among older Irish adults. These data indicate the need for targeted strategies within sections of the older population to improve vitamin D status.
Vitamin D is primarily obtained through the endogenous synthesis in the skin following exposure to UVB sunlight (1). At far latitudes (>50° N), meaningful productive synthesis only occurs during the spring and summer months resulting in an increased dependence on dietary sources during the winter (2). However, foods rich in vitamin D are not typically consumed frequently in the Western diet (1,2). Furthermore, synthesis can also be adversely affected by age, BMI, clothing choice, and sunscreen use, therefore populations residing at far latitudes are vulnerable to the risk of low vitamin D status (1,2). Vitamin D status is typically assessed by measuring the circulating concentration of 25-hydroxyvitamin D (25(OH)D) with deficiency classified as a concentration <30 nmol/L (3). Vitamin D is essential to bone metabolism and is purported to have beneficial health effects for muscle strength, sarcopenia, and nonskeletal health (4,5).
Older adults are heavily dependent on sunshine exposure to contribute to vitamin D status. However, the ability of older adults to synthesize vitamin D is reduced (6). Furthermore, older adults can experience age-related changes such as increased food malabsoprtion (7) and dietary patterns characterized by decreased food quality, quantity, and variety (8). As a result, both the physiological and dietary changes associated with aging can increase the risk of deficiency. For example, it has been reported that mean vitamin D intakes among those aged more than 65 years were only 33% of the UK reference nutrient intake (10 µg/day) (9). Moreover, in community dwelling adults (>65 years) from the Longitudinal Ageing Study Amsterdam (LASA), 45% of men and 56% of women had a 25(OH)D status <50 nmol/L (10).
Globally, health authorities are re-evaluating vitamin D intake guidelines in light of recent North American Institute of Medicine (IOM), European Food Safety Authority (EFSA) and the Scientific Advisory Committee on Nutrition (SACN) UK vitamin D recommendations (3,11,12). Currently, liberal voluntary vitamin D fortification of some food products occurs in Ireland, and to a larger extent in the United States. However, there have been calls for a wider range of foods to be fortified (13). Before further fortification occurs, it is essential to have comprehensive data on the prevalence and determinates of deficiency, particularly in older adults who are most at risk. Data are available on the individual risk factors for vitamin D deficiency, however it is not known how these risk factors impact on and interact with status in the context of older adults (>50 years). The aims of this study were twofold. First, to report the vitamin D status and prevalence of deficiency in a representative sample of older adults in Ireland from The Irish Longitudinal Study on Ageing (TILDA). Second, to investigate the lifestyle, seasonal, geographic, and socioeconomic factors which may impact and interact to influence 25(OH)D concentrations in the older population.
Methods
Study Population
Participants were members of the TILDA Study, a nationally representative cohort of community-dwelling adults aged ≥50 years in Ireland (14). In summary, the first wave of data collection was conducted between October 2009 and July 2011, using a stratified clustered procedure to sample postal addresses from the Irish Geo-Directory, (a listing of all residential addresses). All postal addresses in Ireland were assigned to one of 3,155 geographic clusters using RANSAM (a random sampling design for Ireland) where all household residents aged ≥50 years were eligible to participate, and a sample of 640 of these clusters was selected, stratified by socioeconomic group and geography to maintain a population representative sample (latitude 50–55°N). Clusters were selected with a probability proportional to the number of individuals aged ≥50 years in each cluster. At baseline, 8,175 adults completed a computer-aided personal interview (CAPI), representing a response rate of 62%. Approximately 72.1% (n = 5,895) consented to, and participated in, a health assessment. Of those, 91.3% (n = 5,382) provided a blood sample for 25(OH)D measurement. The study was conducted according to the Declaration of Helsinki guidelines and ethical approval was granted by the Faculty of Health Sciences Research Ethics Committee of Trinity College Dublin.
Demographic and Lifestyle Factors
Participant information recorded included gender, age, habitation (living alone yes/no), currently smoking (yes/no), province of residence: (Leinster—E/SE, Munster—S/SW and the combined provinces of Ulster/Connacht -W/NW), and household housing wealth (measure of economic resource “asset wealth” coded above or below the sample average of 278,359 Euros. Medications taken on a daily basis including prescription, nonprescription and dietary/vitamin supplements were recorded and assigned World Health Organization (WHO) Anatomical Therapeutic Chemical (ATC) classification codes and binariesd to yes/no vitamin D use. Self-reported physical activity levels were assessed and classified using the International Physical Activity Questionnaire (IPAQ) categories: physically active (minimally or health enhancing physically active) versus physically inactive (inactive or insufficiently active). Obesity was measured as a body mass index (BMI) > 30 kg/m2.
Blood Samples
Vitamin D analysis was performed on frozen nonfasting total plasma. Concentrations of 25(OH)D (D2 and D3) were quantified by LC-MS/MS as detailed in the Supplementary Material (Appendix 1). Seasons were defined as winter (December-February), spring (March-May), summer (June-August), and autumn (September-November) (15). Low and high vitamin D synthesis periods were defined as winter-spring and summer-autumn, respectively. As per the IOM, vitamin D guidelines (3), vitamin D deficiency, insufficiency, and sufficiency were defined as <30, 30–50, and >50 nmol/L, respectively.
Statistical Analyses
TILDA samples (n = 26) with 25(OH)D concentrations more than 3 SD from the mean were excluded from the analysis, reducing the sample size to 5,356 participants. Weighted prevalence estimates are reported as percentages and 95% confidence intervals (CI). Weighted geometric means are presented along with 25(OH)D concentrations categorized by IOM cutoffs, stratified by the season sampled (a necessary stratification for far latitude countries) and population characteristics. The weights used in the analysis were derived specifically for those who provided a blood sample; these were calculated by multiplying the base CAPI weight for a given participant by the inverse of the probability that the participant provided a blood sample (probability calculated using a logistic regression model). Pairwise comparisons by vitamin D status cutoffs (deficient, insufficient, sufficient) were computed across variables of interest, see Tables 2 and 3, and false-discovery rate (FDR of q < 0.05) correction for multiple comparisons was applied. Multiple linear regression estimated the effects of health, lifestyle, geographic, and socioeconomic factors on 25(OH)D concentration. Two, three, and four-way interaction terms were specified among these variables, further details are provided in the Supplementary Material (Appendix 1–2). The average R squared across the final imputed models was 0.149 (range: 0.147–0.151). The residuals of both the un-weighted and weighted models were near normal distribution as assessed by q-q plots. All analyses were carried out using STATA 14 (StataCorp, College Station, TX ). Maps of 25(OH)D concentrations were constructed with Quantum Geographic Information System (QGIS) software (version 2.8.3; Open Source Geospatial Foundation).
Mean Plasma 25(OH)D Concentrations (nmol/L) and Weighted Prevalence of Status by Demographic Characteristics in the Low Synthesis Period (winter and spring)
| Characteristic | Subjects | 25(OH)Da | |||
|---|---|---|---|---|---|
| Mean | <30 nmol/L | 30–50 nmol/L | >50 nmol/L | ||
| (n = 2,917) | (n = 574) | (n = 994) | (n = 1,349) | ||
| n | nmol/L (95% CI) | % (95% CI) | %(95% CI) | % (95% CI) | |
| Low synthesis period | 2,917 | 44.1 (43.0–45.2) | 24.2 (21.3–27.2) | 35.0 (31.9–38.1) | 40.8 (37.7–44.0) |
| Age | |||||
| 50–59 y | 1,197 | 42.6 (41.1–44.2) | 21.6 (18.8–24.6) | 38.5 (35.5–41.5) | 39.9 (36.8–43.0) |
| 60–69 y | 981 | 46.6 (45.0–48.3) | 18.1 (15.3–21.0) | 33.7 (30.4–37.2) | 48.2 (44.8–51.6) |
| 70–79 y | 573 | 45.2 (42.9–47.5) | 22.4 (18.8–26.5) | 31.4 (27.2–35.8) | 46.2 (41.6–50.7) |
| >80 y | 162 | 38.0 (34.1–42.4) | 37.1 (29.2–45.6) | 26.8 (20.4–34.1) | 36.1 (28.6–44.3) |
| Gender | |||||
| Male | 1,364 | 41.2 (39.9–42.6) | 24.0 (21.2–26.9) | 37.4 (34.4–40.5) | 38.6 (35.8–41.4) |
| Female | 1,553 | 46.5 (45.0–48.0) | 20.3 (18.0–22.8) | 31.8 (29.2–34.4) | 47.9 (44.9–50.7) |
| p | <.0001* | .388 | .1267 | <.0001* | |
| Habitation | |||||
| Lives alone | 563 | 40.8 (38.6–43.2) | 29.4 (25.0–34.1) | 33.5 (29.0–38.3) | 37.1 (32.6–41.7) |
| Does not live alone | 2,354 | 44.9 (43.7–46.1) | 19.7 (17.7–21.7) | 34.9 (32.8–37.0) | 45.4 (43.0–47.7) |
| p | .0056* | <.0001* | <.0001* | <.0001* | |
| Asset wealth (Euros)b | |||||
| ≤278,359 | 1,499 | 41.3 (39.9–42.7) | 25.3 (22.6–28.0) | 36.3 (33.5–39.0) | 38.4 (35.6–41.0) |
| >278,359 | 1,271 | 47.4 (45.8–49.1) | 17.5 (14.9–19.9) | 31.6 (28.9–34.3) | 50.9 (47.7–53.9) |
| p | <.0001* | <.0001* | <.0001* | .3663 | |
| Supplementsc | |||||
| Supplement user | 268 | 67.7 (64.2–71.4) | 5.2 (2.9–8.8) | 17.6 (12.9–23.5) | 77.2 (70.8–82.4) |
| Nonsupplement user | 2,649 | 42.2 (41.1–43.2) | 23.6 (21.6–25.7) | 36.1 (34.0–38.2) | 40.3 (38.1–42.4) |
| p | <.0001* | <.0001* | <.0001* | <.0001* | |
| Obesity | |||||
| BMI >30 kg/m2 | 981 | 40.0 (38.6–41.5) | 26.5 (23.4–29.7) | 38.9 (35.5–42.2) | 34.6 (31.3–37.9) |
| BMI <30 kg/m2 | 1,928 | 46.0 (44.6–47.4) | 19.7 (17.5–22.1) | 32.4 (30.1–34.6) | 47.9 (45.3–50.4) |
| p | <.0001* | .0001* | <.0001* | <.0001* | |
| Smoking | |||||
| Smoker | 468 | 37.1 (35.0–39.2) | 31.1 (26.3–36.2) | 39.1 (34.2–44.2) | 29.8 (25.6–34.3) |
| Nonsmoker | 2,449 | 45.7 (38.7–42.4) | 19.9 (18.0–21.9) | 33.4 (31.3–35.6) | 46.7 (44.3–48.9) |
| p | <.0001* | <.0001* | <.0001* | <.0001* | |
| Physical activityd | |||||
| Physically active | 2,042 | 45.5 (44.3–46.8) | 19.0 (17.0–21.2) | 35.1 (32.7–37.4) | 45.9 (43.3–48.4) |
| Physically inactive | 851 | 40.5 (38.7–42.4) | 28.4 (24.8–32.2) | 33.4 (29.8–37.1) | 38.2 (34.7–41.6) |
| p | .0009* | .0005* | <.0001* | <.0001* | |
Note: Weighted means and prevalence estimates with 95% CI in winter and spring (December-May). p Values indicate significant pairwise comparisons of the difference in proportion of column criteria-across row variables. 25(OH)D = 25-hydroxyvitamin D. BMI = Body mass index; CI = Confidence interval.
aCutoffs based on the IOM guidelines (3). bMean weighted average household housing wealth. cVitamin D containing supplements were identified using ATC codes. dPhysical activity levels were defined by IPAQ categories. *Significant after adjustment for multiple comparisons (q value < 0.0176).
The Determinants of 25(OH)D Concentrations (nmol/L) in the TILDA Population
| Characteristic | Coefficienta | Linearized SE | p | 95% CI |
|---|---|---|---|---|
| Age: Years | −0.171 | 0.042 | <.0001 | (−2.56–0.87) |
| Gender: Female | 2.619 | 1.069 | .015 | (0.51–4.71) |
| BMIb: Obese | −4.056 | 1.175 | .001 | (−6.36–1.74) |
| Smoking status: Current | −8.976 | 1.877 | <.0001 | (−12.66–5.28) |
| Physical activityc: Inactive | −6.289 | 1.517 | <.0001 | (−9.26–3.30) |
| Supplement used: User | 27.296 | 6.094 | <.0001 | (15.32–39.26) |
| Synthesis periode: High | 5.940 | 1.640 | <.0001 | (2.71–9.16) |
| Province: | ||||
| Ulster and Connacht | −7.172 | 2.139 | .001 | (−11.37–2.97) |
| Munster | −2.246 | 1.741 | .198 | (−5.66–1.17) |
| Asset wealth: > Mean asset wealth | 1.878 | 1.765 | .288 | (−1.58–5.34) |
| Smoking status * BMI: Current * Obese | 4.822 | 3.176 | .130 | (−1.41–11.05) |
| Smoking status * Physical activity: Current * Inactive | 1.550 | 3.959 | .696 | (−6.22–9.32) |
| Physical activity * BMI: Inactive * Obese | 2.563 | 2.305 | .266 | (−1.96–7.09) |
| Smoking status * Physical activity * BMI: Current * Inactive * Obese | −5.851 | 5.515 | .289 | (−16.68–4.98) |
| Province * Synthesis period: Ulster and Connacht * High | 5.281 | 2.590 | .042 | (−1.94–10.36) |
| Munster * High | −1.894 | 2.303 | .411 | (−6.41–2.62) |
| Synthesis period * Asset wealth: High * >Mean | 4.184 | 2.172 | .055 | (−0.82–8.45) |
| Province * Asset wealth: | ||||
| Ulster and Connacht * >Mean | 6.704 | 3.242 | .039 | (0.33–13.07) |
| Munster * >Mean | 4.480 | 2.740 | .103 | (−0.90–9.86) |
| Synthesis period * Province * Asset wealth: | ||||
| Ulster and Connacht * High * >Mean | −16.424 | 4.229 | <.0001 | (−24.73–8.11) |
| Munster * High * >Mean | −3.395 | 3.574 | .343 | (−10.41–3.62) |
| Supplement use * Synthesis period: | ||||
| User * High | −13.647 | 6.801 | .045 | (−27.00–0.29) |
Note: CI = Confidence interval; TILDA = The Irish Longitudinal Study on Ageing.
aRegression Coefficient with 95% CI. bObesity=BMI >30 kg/m2. cPhysical activity levels were defined by IPAQ categories. dVitamin D containing supplements identified by the use of ATC codes. *Interaction term. eLow synthesis period=winter-spring; High synthesis period=summer-autumn.
Results
Study Population
Of the 5,356 participants, the mean age was 62.9 years (age range 50–98) and 53.4% were female. The rate of current smoking was 19.1%, while 68.5% were physically active and 34.6% were obese. Further demographic details of the population have been published elsewhere (14).
Prevalence of Deficiency
The estimated prevalence of vitamin D status within the IOM cutoffs (stratified by season and all months) are displayed in Table 1. After adjusting for seasonality, the weighted prevalence of deficiency was 13.1%, with deficiency higher in winter (24.1%) than summer (5.2%). Geographic variation in the prevalence of deficiency and insufficiency was observed across all seasons, see Figure 1 and Supplementary Figure 1. Across seasons, the Leinster province had the lowest prevalence of deficiency (4.2–21.7%) and insufficiency (22.5–58.2%). Ulster/Connacht had the highest rates of deficiency and insufficiency in the winter (27.6%; 60.4%, respectively) and in the summer (7.0%; 31.7%, respectively). Demographic and lifestyle characteristics by synthesis period and 25(OH)D status are shown in Table 2 (low synthesis period) and Supplementary Table 1 (high synthesis period). In both periods, the more than 80 years age group, those living alone and those with below average asset wealth had a significantly higher prevalence of deficiency. During the low synthesis period, the prevalence of vitamin D sufficiency was higher in women compared to men (47.9% vs 38.6%). The prevalence of vitamin D supplement use was 8.5%, with those supplementing having significantly higher 25(OH)D concentrations and lower prevalence of deficiency throughout both synthesis periods. Vitamin D supplement use was higher among women than men (12.6% vs 4.3%, p < .05) and among the non-obese versus obese (10% vs 5.9%, p < .05). In both synthesis periods, smokers, the obese, and the physically inactive had significantly higher rates of deficiency.
Distribution of Plasma 25(OH)D Concentrations and Weighted Prevalence of Status by Season Sampled
| Winter | Spring | Summer | Autumn | All months | |
|---|---|---|---|---|---|
| (n = 1,166) | (n = 1,751) | (n = 1,348) | (n = 1,091) | (n = 5,356) | |
| 25(OH)D concentration | (95% CI) | (95% CI) | (95% CI) | (95% CI) | (95% CI) |
| Mean (nmol/L) | 42.9 (41.4–44.4) | 44.5 (43.0–46.1) | 60.4 (59.0–61.9) | 52.5 (50.8–54.3) | 51.3 (50.5–52.1) |
| 25(OH)D percentiles (nmol/L) | |||||
| 5th | 18.3 | 17.6 | 29.5 | 23.6 | 20.2 |
| 10th | 21.6 | 21.9 | 35.6 | 29.7 | 25.8 |
| 25th | 30.3 | 32.5 | 48.8 | 40.0 | 36.3 |
| 50th | 43.0 | 47.2 | 64.9 | 55.3 | 52.7 |
| 75th | 62.8 | 64.3 | 79.2 | 72.0 | 71.2 |
| 95th | 92.4 | 95.7 | 102.0 | 97.8 | 98.5 |
| 99th | 115.0 | 120.0 | 117.0 | 111.0 | 116.0 |
| 25(OH)D IOM cutoffsa | % (95% CI) | % (95% CI) | % (95% CI) | % (95% CI) | % (95% CI) |
| <30 nmol/L (Deficiency) | 24.2 (21.3–27.3) | 20.6 (18.3–23.1) | 5.2 (3.9–6.8) | 10.5 (8.3–13.0) | 13.1 (12.1–14.2) |
| 30–50 nmol/L (Insufficiency) | 35.0 (31.9–38.1) | 34.3 (31.7–36.8) | 21.3 (18.7–24.0) | 31.1 (27.8–34.6) | 29.4 (27.8–30.8) |
| >50 nmol/L (Sufficiency) | 40.8 (37.6–44.0) | 45.1 (42.2–48.0) | 73.5 (70.5–76.2) | 58.4 (54.8–61.8) | 57.5 (55.8–59.1) |
Note: Geometric means and weighted prevalence with 95% CI by season sampled (Winter=December-February; Spring=March-May; Summer=June-August; Autumn=September-November). 25(OH)D= 25-hydroxyvitamin D; CI = Confidence interval.
aCutoffs based on the IOM guidelines (3).
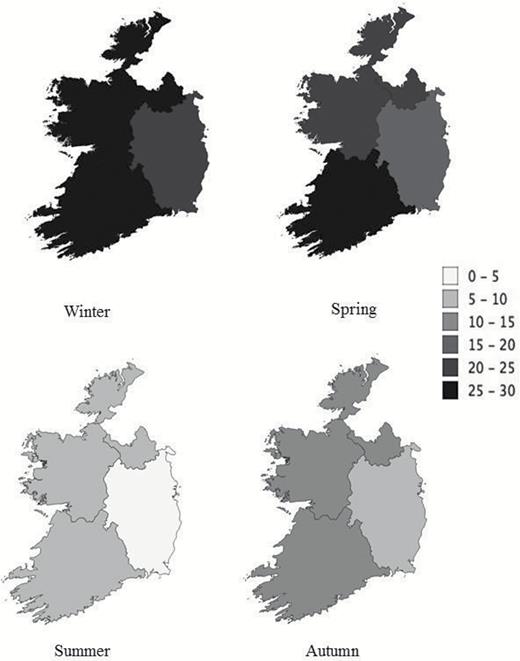
Geographic and seasonal variation in the prevalence (% of population) of 25(OH)D deficiency (<30 nmol/L) in the The Irish Longitudinal Study on Ageing (TILDA) population.
Monthly Variation
The monthly weighted 25(OH)D concentration (mean (nmol/L), 95% CI) is displayed in Figure 2. The lowest concentration was observed in March 2010 (34.0, 30.7–37.6) with concentrations peaking in August 2010 (64.7, 62.0–67.5). When examined by gender, the average percentage difference between the highest and lowest month by 25(OH)D concentration was 75.1% for men and 52.7% for women. Women also experienced less pronounced peaks and troughs in 25(OH)D variation with an average difference of 6.2 nmol/L between the seasons compared with 11.9 nmol/L for men, (see Supplementary Figure 2). Those with asset wealth greater than average achieved sufficiency (>50 nmol/L) 1 month earlier, and maintained sufficiency for longer, compared to those who reported wealth below the mean (see Supplementary Figure 3).
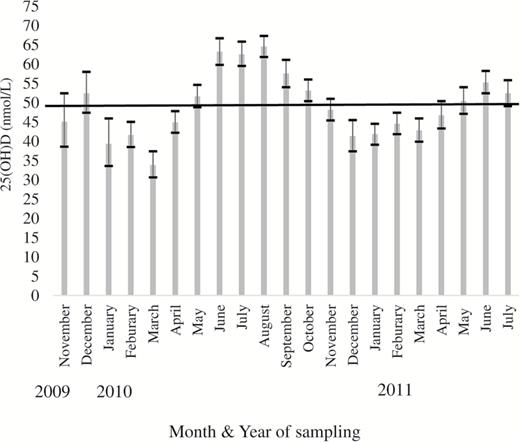
Geometric mean (95% CI) plasma 25(OH)D concentrations in The Irish Longitudinal Study on Ageing (TILDA) participants by year and month of blood sampling. The black line denotes the Institute of Medicine cutoff for sufficiency (>50 nmol/L).
Determinants of 25(OH)D Concentrations
In a multiple linear regression analysis (Table 3), the largest positive correlate of 25(OH)D concentration was vitamin D supplement use (27.2 nmol/L, 95% CI:15.3–39.2, p < .0001). The largest negative predictors included smoking, geographic location, low vitamin D synthesis period, obesity, physically inactive, and older age. We also observed significant interactions amongst geographic location, vitamin D synthesis period, supplement use, and asset wealth (see Supplementary Table 2). Supplement use was positively associated with 25(OH)D in all geographic locations, nonsupplement use was negatively associated with 25(OH)D for those residing in Munster or Ulster/Connacht. We observed a significant interaction between asset wealth, season, and location. In summer, participants with higher wealth residing in Ulster/Connacht had significantly lower vitamin D status, compared with those with similar asset wealth residing in Leinster (see Supplementary Figure 4).
Discussion
To our knowledge, this is one of the largest studies of vitamin D and its determinants that is nationally representative, exclusive to older adults and measures 25(OH)D across all seasons utilizing gold standard LC-MS/MS methodology. We demonstrate that the prevalence of vitamin D deficiency is 13.1% (1 in 8), equivalent to approximately 158,509 Irish adults aged more than 50 years. This is similar to other older populations. In a pooled analysis of European citizens, it was estimated that 13% have a 25(OH)D concentration less than 30 nmol/L (13). Similarly, 11% of Dutch and 12.3% of English adults aged more than 65 years had a 25(OH)D concentration less than 25nmol/L (16,17). Interestingly, in German and Icelandic older adults, higher deficiency rates of 30.2% and 17.1% were observed respectively (18,19). In the only other representative study to examine vitamin D status in Ireland, 12.3% were deficient, but deficiency was not specified for the 369 adults aged more than 50 years (13). The high rates of low status are not surprising given Ireland’s location. At this latitude (similar to the Southern tip of Alaska), synthesis of vitamin D is seasonal with no substantial synthesis for 6 months of the year. This seasonality effect was observed in TILDA where the highest prevalence of deficiency occurred during winter compared to the summer (21.9% vs 4.4%). Moreover, even on a small Island such as Ireland, the small differences in latitude, geographical location, and local climate appear to have meaningful effects. The most northerly region of the Island, receiving the highest rainfall, had significantly increased rates of deficiency compared to the climatically warmer and sunnier southern region.
However, it is important to note that vitamin D status is not solely dependent on latitude and climate. In countries at similar or higher latitudes (≥52°N), the prevalence of deficiency reported has been lower. In Swedish studies of older men and women, the mean vitamin D concentration was 95.0 nmol/L and 69.0 nmol/L, respectively (20,21). This is in comparison to 50.6 nmol/L for men and 52.5 nmol/L for women in TILDA. The stark differences in concentrations could be due to the higher rates of vitamin D food fortification and supplement intakes (22,23). This is further compounded by low vitamin D supplement use at 8.3% among older Irish adults, compared to reports of more than 50% use in Nordic countries (24). Demographic, lifestyle, and socioeconomic factors had a significant influence in the current study. Here, we report 25.3% deficiency among the oldest old (>80 years), which was similar to 33% in the Newcastle 85+ Study (25). With increasing age there is a reduced ability to synthesize vitamin D and a decrease in vitamin D receptor (VDR) numbers (26). In terms of lifestyle, over 20% of smokers versus 11.3% of non-smokers were vitamin D deficient in TILDA. This is similar to findings in Danish women where 20.9% of smokers were deficient versus 13.7% of nonsmokers (27). Smoking can decrease production of 1,25 di-hydroxyvitamin D in lung epithelia and affect 25-hydroxylase activity and VDR expression (28,29). It is unsurprising that obese individuals in our study had significantly higher rates of deficiency compared with normal weight (16.2% vs 11.4%) given that excess adiposity can sequester vitamin D metabolites (30). Similar observations were reported in nearly 4,500 participants from the NHANES study (2005–2006) (31). These associations are further supported by our observation that physically active participants had a significantly higher 25(OH)D concentration than those who were inactive (although physical activity could also be a proxy for sunlight exposure).
In relation to social and economic determinants, those who lived alone or reported asset wealth below the average had more than 1.5 times the prevalence of deficiency. Older adults living alone and those with a lower asset wealth may exhibit a lower diversity of food intake, lower consumption of fish, are more likely to have an unhealthy eating pattern and may have less disposable income for a sun-holiday (32,33). These associations with lower 25(OH)D concentrations are similar to previous studies of state benefit recipients in the United Kingdom and residents of economically deprived areas of Dublin (34,35). Interestingly, we observed those with higher wealth residing in the North West of Ireland had a significantly lower vitamin D status during summer months, compared with those with similar asset wealth residing in the South East. It is possible that geographical area/UVB exposure over-rides the benefit of wealth though this requires further research.
These stark subfactor differences in 25(OH)D status in older adults are particularly relevant given the importance of vitamin D for health. The IOM and UK SACN reports have stated there is an increased risk of negative outcomes for both bone and musculoskeletal health at 25(OH)D concentrations <30nmol/L and <25nmol/L respectively (3,11). At the higher end of the scale, the Endocrine Society Clinical Practice Guideline has set a 25(OH)D concentration >75nmol/L for bone health and fall prevention (36). Using this upper target, over 81.2% of older Irish adults would have an inadequate vitamin D status. Interestingly, we observed a greater seasonal cycling of 25(OH)D with some determinants and in particular gender, with men experiencing greater pronounced peaks and troughs in 25(OH)D variation than women. Supplement use was lower in men although this may not explain all of the difference. Greater 25(OH)D cycling may have negative perturbations for the activity of vitamin D related hydroxylase enzymes (37) which have been suggested to be associated with an increased risk of adverse health outcomes (38). For instance, the seasonality of U.S. death rates could be due, in-part, to seasonal variations in UVB doses affecting 25(OH)D concentrations (39). A recent meta-analysis of 11,321 individuals from 25 randomized controlled trials, found vitamin D supplementation was protective against acute respiratory tract infections (40). This is interesting given the matching seasonality of respiratory infections and vitamin D synthesis, which suggests that vitamin D supplementation may ameliorate the seasonal cycling of 25(OH)D and the subsequent vulnerability to infection.
The strengths of the current study are the large representative sample size, the ability to depict vitamin D status nationwide, and the comprehensive assessment of demographic, geographic, lifestyle, and socioeconomic data. Furthermore, the use of standardized methods performed at a single laboratory to measure 25(OH)D utilizing LC-MS/MS helped minimize analytical variability. Blood sampling occurred throughout all seasons allowing for the examination of seasonal variation. Limitations include the absence of detail on the dosage/frequency of supplements, a record of dietary vitamin D consumption or UVB exposure. Also because of the sampling criteria, these findings may not be applicable to non-Caucasians, older adults in institutional care or those with severe cognitive impairment. In the absence of detailed quantitative data concerning dietary intake of vitamin D, and sun exposure, it is difficult to explain variance in vitamin D status comprehensively in the current cohort—this may account for the reduced R2. Nevertheless, we believe that we have captured quite meaningful variance in vitamin D levels. The fitted models could be improved upon in future analyses with the addition of UVB data.
In conclusion, our findings highlight a widespread prevalence of vitamin D deficiency and insufficiency in the older Irish population with geographical, socioeconomic, and lifestyle factors having a major influence. The findings highlight the need for increased awareness among health care professionals with respect to the factors that can have a negative impact on 25(OH)D concentrations in the elderly adults and are applicable to all countries which experience seasonal sunlight variation. Given the importance of vitamin D for health, it would be prudent for public health action strategies to encourage the maintenance of 25(OH)D concentrations above deficiency cutoffs throughout the year.
Supplementary Material
Supplementary data is available at The Journals of Gerontology, Series A: Biological Sciences and Medical Sciences online.
Funding
This work was supported by the Irish Department of Agriculture, Food and the Marine (13F492); Centre for Ageing Research and Development in Ireland (CARDI-LP3). TILDA is funded by the Irish Government, the Atlantic Philanthropies and Irish Life PLC.
Conflict of Interest
None reported.
References

