


Abstract
Purpose: The antiangiogenic and proapoptotic mechanisms of dietary caloric restriction (DR) are unknown. In this study, we evaluated the effects of moderate (40%) DR on the orthotopic growth of mouse and human brain tumors that differ in cell origin, angiogenicity, host environment, and biochemical composition.
Experimental Design: A malignant mouse astrocytoma (CT-2A) and a human glioma (U87-MG) were highly angiogenic and fast growing, whereas a mouse ependymoblastoma was less vascularized and slower growing. The tumors were evaluated for growth, cell proliferation, microvessel density, and apoptosis under DR and ad libitum feeding. Serum vascular endothelial growth factor and insulin-like growth factor I levels were examined as angiogenic biomarkers.
Results: DR significantly decreased vascularity (factor VIII) and increased apoptosis (terminal deoxynucleotidyl transferase-mediated nick end labeling) in all tumors. These effects were associated with enhanced caspase-3 and poly(ADP-ribose) polymerase cleavage in the CT-2A and ependymoblastoma tumors, but not in the U87-MG tumor. DR also caused reductions of serum insulin-like growth factor I and glucose levels.
Conclusions: DR had significant antiangiogenic and proapoptotic effects in the three distinct brain tumor models. DR, however, had differential effects on cell proliferation, biomarkers of angiogenesis, and apoptosis, suggesting multiple mechanisms of action. Because extensive angiogenesis and resistance to apoptosis are hallmarks of gliomas, this study provides new insight into the molecular basis of the DR-induced inhibition of brain tumor growth.
INTRODUCTION
Underfeeding or dietary restriction (DR) is produced from a total restriction of dietary nutrients and differs from prolonged fasting or starvation in that DR reduces total caloric energy intake without causing anorexia or malnutrition (1, 2, 3, 4, 5). In 1914, Rous (6) first suggested that underfeeding might inhibit mouse tumor growth by delaying tumor vascularity (angiogenesis) from the host. Later studies showed that the antitumor effects of DR resulted from caloric restriction per se and not from the restriction of any specific dietary component such as proteins, vitamins, minerals, fats, or carbohydrates (1, 2, 3, 7). In addition to tumor growth inhibition, DR also produces a marked increase in general health consistent with the notion that the ad libitum feeding of sedentary rodents is overfeeding (3, 8).
Brain tumors are difficult to treat due to aggressive cellular proliferation, extensive invasion, angiogenesis, and reduced apoptosis (9, 10). Vascular endothelial growth factor (VEGF) and insulin-like growth factor (IGF)-I are among the most significant factors in modulating brain tumor progression and angiogenesis (11, 12, 13, 14, 15). VEGF is produced abundantly in gliomas and glioma cell lines, whereas serum VEGF levels are significantly higher in brain tumor patients than in nontumor controls (16, 17). Elevated IGF-I levels are also associated with enhanced brain tumor progression and angiogenesis (18, 19). Indeed, reduced IGF-I levels are associated with reduced angiogenesis and increased apoptosis (2, 20). Recent studies indicate that IGF-I levels and brain tumor growth are dependent on circulating glucose levels (7).
The aspartate-specific cysteinyl caspases, including the executioner caspase-3, are recognized mediators of apoptosis (21, 22, 23, 24). The caspase-3 cleavage of poly(ADP-ribose) polymerase (PARP) is also an early event in the onset of apoptosis (25, 26). No prior studies, however, have evaluated the antiangiogenic and proapoptotic mechanisms of DR in brain tumors. In this study, we evaluated the effects of DR on the orthotopic growth of two mouse syngeneic brain tumors, CT-2A (malignant astrocytoma) and ependymoblastoma (EPEN), and the human U87-MG glioma xenograft. These mouse and human tumors differ in cell origin, angiogenicity, host environment, and biochemical composition, as described previously (27, 28, 29, 30, 31). Whereas tumor growth was rapid with unrestricted feeding, a moderate 40% DR significantly enhanced apoptosis while reducing growth and vascularity in all brain tumor models. DR, however, had differential effects on cell proliferation and biomarkers of angiogenesis and apoptosis, suggesting multiple mechanisms of action.
MATERIALS AND METHODS
Mice.
Mice of the C57BL/6 (B6) strain and the BALBc/J-severe combined immunodeficient (SCID) strain were obtained from Jackson Laboratory (Bar Harbor, ME). The mice were propagated in the animal care facility of the Department of Biology of Boston College, using animal husbandry conditions described previously (32). Male mice (8–10 weeks of age) were used for the studies and were provided with food either ad libitum or under restricted conditions (as described below). Water was provided ad libitum to all mice. The animal room was maintained at 22°C ± 1°C, and cotton nesting pads were provided for additional warmth. The SCID mice were maintained in a pathogen-free room using autoclaved bedding and water. All animal experiments were carried out with ethical committee approval in accordance with the National Institutes of Health Guide for the Care and Use of Laboratory Animals and approved by the Institutional Care Committee.
Brain Tumor Models.
The syngeneic mouse brain tumors, EPEN and CT-2A, were originally produced by implantation of a chemical carcinogen, 20-methylcholanthrene, into the brains of B6 mice (28, 33). The EPEN tumor arose in the cerebral ventricle and was characterized as an EPEN, whereas the CT-2A tumor arose in the cerebral cortex and was characterized as an anaplastic astrocytoma (28, 34). The morphological, biochemical, and growth characteristics of these mouse brain tumors have been described previously (27, 28, 29, 35, 36, 37). The human cell line U87-MG was originally derived from a malignant glioma (glioblastoma) and grown as a nonsyngeneic xenograft in the SCID mice (31). All of the tumors were maintained as serial intracerebral transplants in the Boston College Animal Care Facility.
Intracerebral Tumor Implantation.
The mouse and human tumors were implanted into the cerebral cortex of the B6 or SCID mice, respectively, using a trocar as we described previously (29, 36). Briefly, mice were anesthetized with 2,2,2-tribromoethanol (Sigma Aldrich) intraperitoneally, and their heads were shaved and swabbed with 70% ethanol under sterile conditions. Small tumor pieces (about 1 mm3) from a donor mouse were implanted into the right cerebral hemisphere of anesthetized recipient mice as we described recently (29). All of the mice that recovered from the surgical procedure were returned to their cages when fully active. Greater than 98% of the implanted mice recover from the procedure. Initiation of tumors from intact tumor pieces is preferable to initiation from cultured cells because the pieces already contain an established microenvironment that facilitates tumor growth (29).
Dietary Restriction.
The mice were group-housed before the initiation of the experiment and then separated and randomly assigned to either a control group that was fed ad libitum or an experimental group that was fed a total DR of approximately 40% (60% of the control group). Within each experiment, the ad libitum-fed and DR-fed mice were matched for age and body weight. Each mouse was housed singly in a plastic shoebox cage with a filter top and given a cotton nesting pad for warmth. DR was initiated 24 h after tumor implantation and continued for 15 days for tumor growth analysis. This day was chosen because food intake decreases and morbidity occurs after this time for mice with the CT-2A and U87-MG tumors fed ad libitum. Total DR maintains a constant ratio of nutrients to energy, i.e., the average daily food intake (grams) for the ad libitum-fed mice was determined every other day, and the DR-fed mice were given 60% of that quantity on a daily basis, as we described previously (2, 38). All mice received PROLAB RMH 3000 chow (LabDiet, Richmond, IN) that contained a balance of mouse nutritional ingredients and delivered approximately 4.4 kcal/g gross energy according to the manufacturer’s specifications. Body weights of all of the mice were recorded every other day.
Tumor Growth.
Intracerebral tumor growth was analyzed directly by measuring total tumor weight. The mice used for these studies were sacrificed using isoflurane anesthesia (Halocarbon). Tumors were dissected from normal-appearing brain tissue and analyzed as either dry weights after freezing and lyophilization (CT-2A) or as wet weights (EPEN and U87-MG). From our experience, total tumor dry weight is a more accurate measure of tumor growth than total wet weight for individual CT-2A tumors because these tumors vary in the degree of hemorrhage and edema. The EPEN and U87-MG tumors have less edema and hemorrhage than the CT-2A tumor and are easily analyzed as wet weights.
Histology.
Tumor samples were fixed in 10% neutral buffered formalin (Sigma, St. Louis, MO) and embedded in paraffin. Tumors were sectioned at 5 μm, stained with H&E, and examined by light microscopy. For the histological studies, DR was initiated as described above and continued for 11 days instead of 15 days to prevent tumor-associated tissue distortion.
Factor VIII Staining and Microvessel Quantitation.
Tumor sections were incubated with trypsin at 37°C for 30 min after deparaffinization, rehydration, and washing as we described recently (2, 38). Briefly, the sections were quenched with 0.3% H2O2-methanol for 30 min and then blocked with 10% normal goat serum in 100 ml of 0.01 m phosphate and 0.9% sodium chloride (pH 7.4) with 1.0 g of bovine serum albumin and 0.1 ml of Tween 20 (PBA buffer). The sections were treated with rabbit polyclonal antibody directed against human factor VIII-related antigen (Dako Corp., Carpinteria, CA; 1:100 dilution with PBA) followed by a biotinylated antirabbit IgG at 1:100 dilution (Vector Laboratories, Inc., Burlingame, CA). The sections were then treated with avidin-biotin complex followed by 3,3′-diaminobenzidine as substrate for staining according to the manufacturer’s directions (Vectastain Elite ABC kit; Vector Laboratories, Inc.). The sections were then rinsed three times with PBS (0.01 m phosphate buffer with 0.9% NaCl). Sections were counterstained with methyl green and mounted. Corresponding tissue sections without primary antibody served as negative controls. Microvessel density (MVD) was quantified by examining areas of vascular hot spots as described previously by Weidner et al. (39), with some modifications. Sections were scanned at low magnification (×40 and ×100) for the localization of vascular hot spots. The three most vascular areas of the tumor not containing necrosis were determined and then counted at higher magnification (×200). The values of the three sections were averaged for all tumors, and the number of independent tumors analyzed is shown in Table 1. Branching structures were counted as a single vessel as described previously (2).
In situ Apoptotic Cell Detection (Terminal Deoxynucleotidyl Transferase-Mediated Nick End Labeling).
Apoptotic cells were detected using the ApopTag in situ detection kit [terminal deoxynucleotidyl transferase-mediated nick end labeling (TUNEL); Intergen, Purchase, NY], as we described previously (2, 38). After deparaffinization, rehydration, and washing in PBS, the tissue sections were treated with proteinase K (20 μg/ml) for 15 min at room temperature and then washed in PBS. The sections were treated with 3% H2O2 in PBS for 5 min to quench endogenous peroxide activities. The 3′ hydroxy DNA strand breaks were enzymatically labeled with digoxygenin nucleotide via terminal deoxynucleotidyltransferase and incubated for 1 h at 37°C. The reaction was terminated with stop buffer according to the manufacturer’s protocol. Sections were then treated with anti-digoxygenin peroxidase for 30 min at room temperature, washed, stained with 3,3′-diaminobenzidine substrate, counterstained with methyl green or hematoxylin, and mounted. Tissue sections of post-weaning normal female mouse mammary glands, provided by Intergen, were used as a positive control, and staining of a corresponding tissue section without added terminal deoxynucleotidyltransferase served as the negative control.
The apoptotic index (AI%) was expressed as follows: AI% = A × 100/(A + C), where A = the number of TUNEL-positive cells, and C = the number of counterstained unlabeled cells. The tumor sections were scanned at lower magnification (×40 and ×100) for nonnecrotic areas, and approximately 2000 total cells were counted for each section at higher magnification (×400). The values of three sections were averaged for all tumors, and the number of independent tumors analyzed is shown in Table 1.
Proliferation Index.
Proliferation index measured the fraction of cells with proliferating cell nuclear antigen (PCNA) staining as we described previously (2, 38). After deparaffinization, rehydration, and washing, the tissue sections were soaked in 10 mm citrate buffer (pH 6.0). The sections were heated in a microwave oven for 15 min (defrost cycle) and then cooled to room temperature to unmask the PCNA. Sections were then stained by the same procedures as described above, except we used 10% horse serum as blocking agent and mouse PCNA monoclonal antibody (Dako) as the primary antibody. Light microscopy (×400) was used to count both PCNA-positive proliferating cells and total tumor cells in three nonnecrotic areas of each tissue section, as shown previously (2, 38). The values of the three sections were averaged for all tumors, and the number of independent tumors analyzed is shown in Table 1.
Measurement of Serum Glucose.
Blood was collected from mice on the last day of the experiment and before tumor resection. The mice were anesthetized with isoflurane, and blood was collected from the heart. All mice were fasted for 3 h before blood collection. The blood was centrifuged at 1600 × g for 10 min, and the serum was collected and stored at −80°C until assayed. Serum glucose concentration (mm) was measured spectrophotometrically using the Trinder assay (Sigma).
Vascular Endothelial Growth Factor Analysis.
A commercially available kit (Mouse VEGF; R&D) was used to measure VEGF levels following the enzyme-linked immunosorbent assay protocol recommended by the manufacturer. Briefly, 100 μl of serum and standard for VEGF were added to a microplate coated with monoclonal antibody for VEGF. The plate was incubated at room temperature for 2 h and then washed three to four times to remove any unbound substances. Conjugated antibody was added to the wells, and the mixtures were incubated for 2 h at room temperature, followed by another washing. A substrate solution was added to the wells and incubated for 30 min at room temperature. The color development was stopped, and the intensity of the color was measured at 450 nm, with reference wavelength at 540 nm. The concentration was calculated against a standard curve, and the results were expressed in pg/ml.
Insulin-Like Growth Factor I Analysis.
Serum IGF-I concentrations were measured by radioimmunoassay (Nichols Institute Diagnostics, Capistrano, CA) with purified IGF-I as the standard and controls supplied by the kit, as we described previously (2).
Caspase-3 and Poly(ADP-ribose) Polymerase Analysis.
Tumor tissues were homogenized in ice-cold lysis buffer (Cell Signaling Technology) containing 20 mm Tris-HCl (pH 7.5), 150 mm NaCl, 1 mm Na2EDTA, 1 mm EGTA, 1% Triton, 2.5 mm Na PPi, 1 mm α-glycerophosphate, 1 mm Na3VO4, 1 μg/ml leupeptin, and 1 mm phenylmethylsulfonyl fluoride. Lysates were transferred to Eppendorf tubes, mixed on a rocker for 1 h at 4°C, and then centrifuged at 8100 × g for 20 min. Supernatants were collected, and protein concentrations were estimated by the Bio-Rad DC protein assay. Approximately 10 μg of total protein from each sample were loaded on a 12% SDS-polyacrylamide gel (Bio-Rad) and electrophoresed. Proteins were transferred to an immobilon TM-P membrane (Millipore) overnight at 4°C and blocked in 5% nonfat powdered milk in Tris-buffered saline with Tween 20 (pH 7.6) for 3 h. Blots were then probed with caspase-3 or PARP polyclonal antibody (Cell Signaling Technology) overnight at 4°C with gentle shaking. The blots were then incubated with antirabbit whole horseradish peroxidase-conjugated secondary antibody at room temperature. Bands were visualized using enhanced chemiluminescence plus detection system (Amersham). Blots were reprobed with β-actin antibody (Novus Biologicals) as a loading control, and the ratio of caspase-3 or PARP to actin was analyzed by scanning densitometry.
Statistical Analysis.
Body weight, food intake, tumor growth, and serum quantitative measurements were analyzed by analysis of variance followed by Fisher’s PLSD to calculate two-sided pairwise comparison among different test groups by use of Statview 5.0. In each figure, n designates the number of individual mice analyzed. The minimum number of samples analyzed for each experiment was based on the variance in the untreated control group or on power analysis using formula 17.21 as described previously (40). Error bars on figures are expressed as 95% confidence intervals (1.96 × SE of mean) according to recommended standards (41).
RESULTS
Energy Intake, Body Weight, and Serum Glucose.
The total energy intake of the ad libitum-fed B6 mice was about 12–14 kcal/day and rose to about 20–24 kcal/day after tumor implantation. The increased food intake was not associated with increased body weight. This increased energy intake results from hyperphagia that may be associated with cerebral hyperglycolysis after tumor implantation as we described previously (38). Similar findings occurred in sham-operated mice, suggesting that tumor implantation increased basal metabolic rate. The total energy intake was adjusted to about 40% less in the DR-fed mice daily. This produced about a 12–15% reduction in body weight (28.1 ± 1.0 to 24 ± 0.8 g in the ad libitum- and DR-fed mice, respectively) that remained significantly lower (P < 0.01) in the DR-fed mice throughout the study. Serum glucose levels were significantly lower in the DR-fed mice (8.0 ± 2.6 mm) than in the ad libitum-fed mice (12.0 ± 1.8 mm; P < 0.01), as we described previously for this strain (7).
Total caloric intake at the start of the experiment was greater in the SCID mice than in the B6 mice. In contrast to the tumor-bearing B6 mice, food intake was more erratic in the tumor-bearing SCID mice. These differences between the B6 and SCID strains may reflect physiological differences in food intake and tumor implantation. Body weights were also about 12–15% lower in the DR-fed mice than in the ad libitum-fed SCID mice. Serum glucose levels were significantly lower in the DR-fed mice (6.0 ± 0.7 mm) than in the ad libitum-fed mice (12.5 ± 1.6 mm; P < 0.01).
Tumor Growth.
DR significantly reduced brain tumor weights in the three tumor models (Fig. 1). Dry weights were measured for the CT-2A tumors, and wet weights were measured for the EPEN and U87-MG tumors. The weights of the CT-2A, EPEN, and U87-MG tumors were approximately 80%, 63%, and 60% less under DR feeding than under ad libitum feeding, respectively. These reductions in tumor weight greatly exceeded the reductions in the body weight. It is important to mention that all implanted tumors grew in both the DR-fed and ad libitum-fed groups, indicating that restricted feeding did not prevent tumor “take” or establishment but significantly reduced the intracerebral growth.
Tumor Vascularity, Apoptosis, and Cell Proliferation.
To determine whether DR influenced tumor angiogenesis, we examined tumor morphology and MVD using H&E staining and factor VIII immunostaining, respectively (Fig. 2; Table 1). MVD was greatest in the U87-MG tumor and lowest in the EPEN tumor in the ad libitum-fed mice. The number and size of tumor blood vessels as seen with H&E staining and MVD were significantly smaller in the DR-fed mice than in the ad libitum-fed mice for each model (Fig. 2; Table 1). These findings show that DR reduces angiogenesis in both the mouse and human brain tumor models.
We next compared the number of TUNEL-positive cells (apoptotic index) in the ad libitum-fed and DR-fed mice to determine whether DR influenced programmed cell death (apoptosis). The apoptotic index for each tumor was at least 2-fold greater in the DR-fed mice than in the ad libitum-fed mice (Fig. 2; Table 1). These findings show that DR is proapoptotic in both the mouse and human brain tumor models. The number of TUNEL-positive cells was significantly greater in the CT-2A and EPEN mouse tumors than in the U87-MG human tumor, indicating differences in programmed cell death (Table 1).
The PCNA index was similar between the DR-fed and ad libitum-fed mice for the CT-2A and EPEN tumors, indicating that DR does not reduce cell proliferation in these tumors (Table 1). However, the PCNA index was significantly greater in the CT-2A tumor than in the EPEN tumor. This is consistent with findings that the growth rate is significantly greater in the CT-2A tumor than in the EPEN tumor (28, 29). In contrast to the mouse brain tumors, the PCNA index was significantly lower in the DR-fed SCID mice than in the ad libitum-fed SCID mice for the U87-MG tumor (Table 1). These findings indicate that DR has differential effects on the cell proliferation rate in the mouse and human brain tumor models.
Serum Insulin-Like Growth Factor I Levels.
IGF-I is considered a biomarker of angiogenesis and tumor progression (2, 19, 20). Circulating IGF-I levels were significantly lower in the DR-fed mice than in the ad libitum-fed mice for each tumor (Table 1). IGF-I levels were lower in mice bearing the EPEN tumor than in mice bearing the CT-2A or U87-MG tumor, whereas IGF-I levels were generally higher in the ad libitum-fed SCID mice than in the B6 mice. For reference, the serum IGF-I levels in non-tumor-bearing B6 and SCID mice were 200 and 290 ng/ml, respectively. These findings suggest that tumor type and host environment influence circulating IGF-I levels. The changes in serum IGF-I levels were positively related to changes in MVD and inversely related to changes in the apoptotic index.
Serum Vascular Endothelial Growth Factor Levels.
VEGF is an endothelial cell-specific mitogen that is a reliable biomarker of angiogenesis in human brain tumors (11, 14, 15, 16). DR significantly reduced circulating VEGF levels in mice bearing the CT-2A tumor and the U87-MG tumor but had no significant effect on VEGF levels in mice bearing the EPEN tumor (Table 1). For reference, the serum VEGF levels in non-tumor-bearing B6 and SCID mice were 82 and 86 pg/ml, respectively. It is interesting that the VEGF level in ad libitum-fed mice bearing the EPEN tumor (86 pg/ml) was similar to the level in non-tumor-bearing B6 mice (82 pg/ml) and to the levels in DR-fed mice bearing either the CT-2A or U87-MG tumor (80 and 100 pg/ml, respectively). These findings indicate that circulating VEGF levels are not elevated in the less vascularized EPEN tumor and that DR has differential effects on VEGF levels in the mouse and human brain tumor models.
Tumor Caspase-3 Activation and Poly(ADP-ribose) Polymerase Cleavage.
To determine whether the DR-induced increase in TUNEL-positive cells was associated with an apoptotic-mediated mechanism, we evaluated caspase-3 activation and PARP. Pro-caspase-3 and uncleaved PARP levels were similar in the ad libitum-fed and DR-fed mice for each tumor (Fig. 3,A). DR had differential effects on caspase-3 activation and PARP cleavage in the human and mouse tumor models. Using actin content as an internal control, we found that DR significantly elevated caspase-3 and cleaved PARP content in the CT-2A and EPEN tumors, but not in the U87-MG tumor (Fig. 3, A and B). These findings indicate that caspase-3 activation and PARP cleavage are associated with enhanced apoptotic index in the CT-2A and EPEN mouse tumors, but not in the U87-MG human tumor.
General Health of the Mice.
All DR-fed mice appeared more healthy and active than their ad libitum-fed controls as assessed by ambulatory and grooming behavior. No adverse effects were seen in either the B6 or SCID mice maintained on 40% DR. Also, no signs of vitamin or mineral deficiency were observed in the DR-fed mice according to standard criteria (42). These findings concur with the well-recognized health benefits of mild to moderate DR in laboratory rodents (3, 4, 8, 43).
DISCUSSION
We found that DR had significant antiangiogenic and proapoptotic effects in several brain tumor models that differ in cell origin, angiogenicity, host environment, and biochemical composition. DR reduced vascularity irrespective of the intrinsic angiogenicity of the tumor. For example, DR reduced MVD in the highly angiogenic mouse CT-2A and human U87-MG tumors and in the less angiogenic mouse EPEN tumor. Although DR reduced VEGF levels in mice bearing the CT-2A and U87-MG tumors to levels found in non-tumor-bearing mice, DR had no noticeable effect on circulating VEGF levels in mice bearing the EPEN tumor, despite reducing vascularity. Because VEGF gene expression is lower in cultured EPEN cells than in CT-2A cells,1 it is possible that angiogenic factors other than VEGF contribute to the EPEN tumor vascularity. Hence, DR may reduce brain tumor vascularity through both VEGF-mediated and non-VEGF-mediated mechanisms.
Significant reductions in circulating IGF-I levels were also associated with the antiangiogenic and proapoptotic effects of DR in the mouse and human brain tumors. Our findings agree with previous studies in other tumor models that reduced IGF-I levels can be antiangiogenic and proapoptotic (2, 18, 19, 20). There is also evidence that dietary energy intake influences IGF-I levels and that IGFs counteract glucocorticoid-induced apoptosis in the immune system (7, 44, 45). This may account in part for the beneficial role of reduced IGF-I and elevated glucocorticoids during caloric stress (46). Hence, the proapoptotic and antiangiogenic effects of DR can result, in part, from reductions in IGF-I levels.
Our findings also provide insight on the DR-induced cell death pathway. We observed that DR increased caspase-3 activation and PARP cleavage in the syngeneic CT-2A and EPEN tumors, but not in the U87-MG xenograft tumor. Indeed, caspase-3 activation and PARP cleavage were undetectable under either ad libitum or DR feeding in the U87-MG tumor. Caspase-3 activation is tightly coupled to PARP cleavage in many tumor cell lines and is important for the rapid onset of apoptosis (25, 47). Previous studies showed that expression of active caspase-3 does not overlap completely with that of apoptotic nuclei in various human brain tumors, suggesting the participation of caspase-3-independent cell death pathways in these tumors (22, 23, 48). Furthermore, Jiang et al. (9) reported that U87-MG cell death after bcl-2/bcl-xL bispecific antisense treatment involved caspase-6 and caspase-7, but not caspase-3. Therefore, DR might influence U87-MG cell death through non-caspase-3-PARP-mediated mechanisms. We also do not exclude the possibility that other caspases are activated in the CT-2A and EPEN tumors.
We found that DR reduced proliferation in the human U87-MG tumor, but not in the mouse CT-2A or EPEN tumors. These findings agree with previous studies that antiangiogenic therapies can have differential effects on tumor cell proliferation (49, 50). It will be interesting to determine whether the differential effects of DR on apoptosis, angiogenesis, and cell proliferation arise from differences intrinsic to the tumor cells or to differences in the host environment.
Our findings with these experimental brain tumors are relevant to those in vivo studies in which food intake and body weight are reduced in conjunction with antiangiogenic or proapoptotic cancer therapies. For example, if a new antiangiogenic drug reduces both body weight and tumor growth in experimental test subjects, it is necessary for the investigators to demonstrate the extent to which the antiangiogenic effect is due to an endothelial cell-specific effect or to an indirect effect of DR. Tannenbaum (3) and Mukherjee et al. (51) previously mentioned that tumor therapies that secondarily restrict food intake or assimilation may produce changes in tumor growth that could be mistaken for a primary effect. Recent studies also indicate that many antitumor drugs may also have “accidental” antiangiogenic effects (52). We suggest that brain cancer therapies that reduce tumor growth while also reducing food intake and body weight may operate in large part through the antiangiogenic and proapoptotic effects of DR.
Although DR significantly reduced brain tumor growth, it is not yet clear whether DR would also increase the survival time of the tumor-bearing mice. Survival studies are difficult with rapidly growing mouse brain tumors implanted as tissue pieces rather than as cultured cells. Additional studies using cultured tumor cells or implantation into the flank may better assess the effects of DR on survival. It is also necessary to mention that weight loss associated with cancer cachexia differs from weight loss associated with anorexia because cachexia can occur without anorexia and is produced from factors actively released by the tumor (53). We previously suggested that DR might antagonize cachexia by reducing the levels of procachexic factors through reduced tumor size (38).
In summary, our results show that restricted food or energy intake can have powerful antiangiogenic and proapoptotic effects on rapidly growing mouse and human brain tumors. Furthermore, these effects arise through multiple molecular and cellular mechanisms that ultimately relate to defects in tumor cell energy metabolism. Our findings suggest that DR can be used to exploit the metabolic weakness of brain tumor cells to enhance apoptosis and reduce angiogenesis.
Grant support: National Institutes of Health Grants HD39722 and CA102135, the Boston College Research Expense Fund, and a grant from the American Institute of Cancer Research.
The costs of publication of this article were defrayed in part by the payment of page charges. This article must therefore be hereby marked advertisement in accordance with 18 U.S.C. Section 1734 solely to indicate this fact.
Requests for reprints: Thomas N. Seyfried, Biology Department, Boston College, 140 Commonwealth Avenue, Chestnut Hill, MA 02467. Phone: (617) 552-3563; Fax: (617) 552-2011; E-mail: thomas.seyfried@bc.edu
Unpublished data.
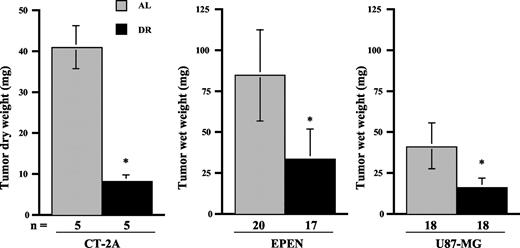
Influence of DR on the intracerebral growth of experimental brain tumors. DR was initiated 24 h after tumor implantation and continued for 15 days. Values are expressed as means with 95% confidence intervals, and n = the number of tumor-bearing mice examined in each group. The asterisks indicate that the tumor weights of the DR groups were significantly lower than those of the control groups at P < 0.01.
Influence of DR on the intracerebral growth of experimental brain tumors. DR was initiated 24 h after tumor implantation and continued for 15 days. Values are expressed as means with 95% confidence intervals, and n = the number of tumor-bearing mice examined in each group. The asterisks indicate that the tumor weights of the DR groups were significantly lower than those of the control groups at P < 0.01.

Morphology, vascularity, and apoptosis in ad libitum-fed and DR-fed mice bearing the intracerebral EPEN and U87-MG brain tumors. DR was initiated 24 h after tumor implantation and continued for 11 days. A, H&E-stained tumor sections (×100). B, factor VIII-immunostained microvessels (×200). C, TUNEL-positive apoptotic cells (arrows; ×400). All images were produced from digital photography.
Morphology, vascularity, and apoptosis in ad libitum-fed and DR-fed mice bearing the intracerebral EPEN and U87-MG brain tumors. DR was initiated 24 h after tumor implantation and continued for 11 days. A, H&E-stained tumor sections (×100). B, factor VIII-immunostained microvessels (×200). C, TUNEL-positive apoptotic cells (arrows; ×400). All images were produced from digital photography.

Western blot analysis of caspase-3 activation and PARP cleavage in ad libitum-fed and DR-fed mice bearing intracerebral experimental brain tumors. DR was initiated as shown in Fig. 1. A, two independent tumor samples from ad libitum-fed and DR-fed mice. Equal amounts of protein (10 μg) were loaded into each lane, and the other conditions were as described in “Materials and Methods.” B, ratio of activated caspase-3 and cleaved PARP to β-actin in the CT-2A and EPEN tumors of ad libitum-fed and DR-fed mice. Values are expressed as means with 95% confidence intervals. Asterisks indicate that the values are significantly greater in the tumors of DR-fed mice than in those of ad libitum-fed mice at P < 0.01.
Western blot analysis of caspase-3 activation and PARP cleavage in ad libitum-fed and DR-fed mice bearing intracerebral experimental brain tumors. DR was initiated as shown in Fig. 1. A, two independent tumor samples from ad libitum-fed and DR-fed mice. Equal amounts of protein (10 μg) were loaded into each lane, and the other conditions were as described in “Materials and Methods.” B, ratio of activated caspase-3 and cleaved PARP to β-actin in the CT-2A and EPEN tumors of ad libitum-fed and DR-fed mice. Values are expressed as means with 95% confidence intervals. Asterisks indicate that the values are significantly greater in the tumors of DR-fed mice than in those of ad libitum-fed mice at P < 0.01.
Effects of DR on biomarkers for vascularity and apoptosis in CT-2A, EPEN, and U87-MG brain tumors
| Tumors | Diet | MVD | Apoptotic index % | Proliferation index % | IGF-I (ng/ml) | VEGF (pg/ml) |
|---|---|---|---|---|---|---|
| CT-2A | AL | 24.3 ± 1.4 (5) | 3.7 ± 0.4 (5) | 71 ± 3 (5) | 273 ± 63 (12) | 118 ± 17 (5) |
| DR | 10.3 ± 3.1† (5) | 8.1 ± 1.2† (5) | 68 ± 2 (5) | 170 ± 29† (17) | 80 ± 17* (5) | |
| EPEN | AL | 7.7 ± 2.4 (6) | 3.4 ± 0.9 (6) | 48 ± 3 (3) | 149 ± 19 (4) | 86 ± 19 (4) |
| DR | 3.6 ± 1.2* (5) | 8.1 ± 2.9† (5) | 43 ± 2 (3) | 77 ± 44† (4) | 94 ± 43 (4) | |
| U87-MG | AL | 51.0 ± 9.4 (7) | 0.9 ± 0.1 (3) | 85 ± 5 (3) | 370 ± 134 (5) | 136 ± 22 (5) |
| DR | 28.3 ± 3.3† (3) | 3.7 ± 1.8* (3) | 65 ± 5† (3) | 158 ± 25† (6) | 100 ± 8* (7) |
NOTE. Animals were fed either ad libitum or under DR as described in “Materials and Methods.” All values are expressed as means ± 95% confidence intervals. The details for each measurement and statistics are described in “Materials and Methods.” To determine MVD, factor VIII-positive microvessels were averaged in three hot spot areas of each tumor section per high-powered field. Apoptotic index was determined by TUNEL assay. Proliferation index was determined by PCNA assay. Numbers in parentheses represent the number of independent samples analyzed.
Abbreviation: AL, ad libitum.
Values from the DR group differed from those of the ad libitum group at P < 0.05, as determined by analysis of variance.
Values from the DR group differed from those of the ad libitum group at P < 0.01, as determined by analysis of variance.
Acknowledgments
We thank Dr. Grant Balkema and Nicholas T. Seyfried for technical support. We also thank Dr. Richard McGowan for help with the statistical analysis of data.