


Abstract
Conservation is ultimately about safeguarding biodiversity by arresting and reversing the impacts of threatening processes. Although data on the distributions of species are increasingly well resolved, the spatial distributions of threats to species are poorly understood. We mapped the distributions of eight major threats to Australia's threatened plants, vertebrates, and invertebrates using the geographic ranges of species affected by particular threats as surrogates for their spatial occurrence. Our results indicate that simply quantifying the proportion of species affected by particular threatening processes does not adequately capture the variation in the spatial extent, prevalence, or predominance of threats to species. Conservation planning is an inherently spatial process; therefore, explicitly considering the spatial dimension of threats could significantly enhance our ability to direct efforts to areas where the greatest conservation outcomes can be delivered.
Global species extinctions currently exceed the background extinction rate by several orders of magnitude (Pimm et al. 1995, Woodruff 2001), and it is widely accepted that human influence is the ultimate driver of this biodiversity crisis (Ceballos and Ehrlich 2002, Davies et al. 2006, Ehrlich and Pringle 2008). The most recent International Union for Conservation of Nature (IUCN) Red List describes an ever-worse situation for the world's biodiversity, with at least 38% of all known species facing extinction in the near term (Vié et al. 2009). Habitat loss is the most pressing threat to species persistence at the global scale (Baillie et al. 2004), and frequently at the national scale (Wilcove et al. 1998, Venter et al. 2006). However, a range of other threats also drive species endangerment, and the relative importance of particular types of threat varies across taxonomic groups (Mace and Balmford 2000, Stuart et al. 2004) and habitats (Richter et al. 1997, Kappel 2005).
Quantifying the number of species affected by specific threats can assist in identifying broad trends in species endangerment, but the value of such analyses in informing practical efforts to conserve threatened species is limited (Prugh et al. 2010). One important reason for this disparity is the existence of spatial variation in the distributions of threats to biodiversity. Spatial quantification of threats has been conducted at a regional scale for fresh-water fishes (Clavero et al. 2010), but most studies that have examined the distributions of major threats to species have done so only at the global scale (Stuart et al. 2004, Schipper et al. 2008), or through broad examinations of regional differences (Li and Wilcove 2005, Venter et al. 2006). There is expected to be considerable fine-grained variation in the presence and impact of threatening processes to species where both anthropogenic influences and the distributions of species are spread heterogeneously across the land- or seascape (Sanderson et al. 2002, Halpern et al. 2008a). An understanding of this variation is therefore important as it can assist in determining the most appropriate actions to alleviate threats to species persistence.
Conservation planning is the process by which actions, locations, or projects are selected for investment in order to achieve the best outcomes for biodiversity conservation (Margules and Pressey 2000). Spatial conservation prioritization techniques have now emerged that are capable of guiding investments into specific management actions to mitigate processes that are threatening species in a given location (Wilson et al. 2007, Evans et al. 2011). Alongside information on the expected benefits and costs of different types of management, such techniques can benefit greatly from information that not only details the spatial distributions of biodiversity features we wish to conserve but also the processes that imperil them.
Here, we determine the major threatening processes affecting extant threatened plants, vertebrates, and invertebrates in Australia, and subsequently map the spatial distribution of these threats across the Australian continent using models of species distributions. Despite the relatively recent European settlement of Australia, the continent's biodiversity is highly threatened (Lindenmayer 2007, Mackey et al. 2008); nearly half of all global mammalian extinctions in the last 200 years occurred in Australia (Short and Smith 1994). Burgman and colleagues (2007) examined threat syndromes affecting native plants in Australia, and Kingsford and colleagues (2009) reported the proportion of species affected by four major threats within a sample of 370 Australian species listed on the IUCN Red List. In this article, we advance on these previous efforts and determine the prevalence of major threats in Australia by considering the widest taxonomic sample of species considered so far, and additionally quantify and map the spatial distributions of these threats. Our analysis is significant from a global perspective because Australia supports the greatest number of endemic nonfish vertebrate species of all of Earth's 17 megadiverse countries (Mittermeier et al. 1997, ASEC 2001). Our work also represents the first attempt to spatially quantify and map the distributions of major threats to species at a continental scale.
Collection and analysis of threat data
At the time of this study, 1700 species of vascular and nonvascular plants, vertebrates, and invertebrates were considered nationally threatened, having been listed under the Australian Commonwealth Environmental Protection and Biodiversity Conservation Act 1999 (EPBC Act; DEWHA 2008a). Information on threats to each listed species, both known and perceived, was extracted from a range of documents, including commonwealth listing and conservation advices, approved and draft species recovery plans, approved threat-abatement plans, species profiles, and other published material. Much of the source data can be viewed online at the Species Profile and Threats Database (www.environment.gov.au/sprat). Following the threat categorization outlined by Venter and colleagues (2006), we identified eight broad categories of threat: habitat loss, introduced species, inappropriate fire regimes, disease, pollution, overexploitation, native species interactions, and natural causes table 1). Inappropriate fire regimes were considered a distinct category of threat (rather than falling under natural causes as in Venter et al. 2006) because fire is actively managed over large parts of Australia and has complex and pervasive impacts on the landscape and its biodiversity (Russell-Smith et al. 2007). Disease was also separated from the broader categories of native species interactions and introduced species to distinguish pathogens from the wide range of invasive plants and animals in Australia (Low 1999). We have analyzed threats according these broadscale categories to enable comparison with other studies at the national and global scale, although the appropriate detail in threat classifications is likely to vary depending on the spatial scale and context of a particular conservation planning problem.
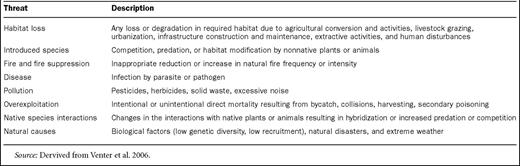
Definitions of the eight major threat categories considered in this analysis.
Species were classified as predominantly marine, terrestrial, or freshwater according to conservation advice and recovery plan documents. Overall, data for the eight broad threat categories defined above were available for a total of 1304 EPBC listed species, 1298 of which are extant table 2). A Pearson's χ2 contingency test was used to assess differences in the frequency of threats to species according to habitat preference at a national scale. We used a two-sample t-test to determine whether the mean number of broadscale threats faced varied among plants and animals, and a one-way analysis of variance with a Tukey honestly significant difference (HSD) correction to compare the mean number of threats among habitat types. All statistical analyses were implemented using R statistical package version 2.9.1 (R Development Core Team, 2008).
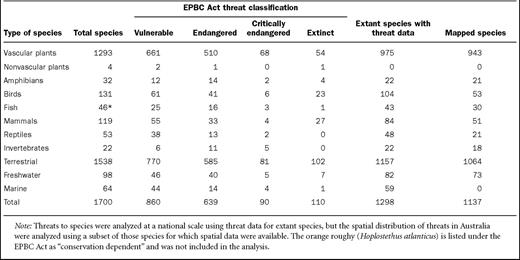
Numbers of threatened species listed under the provisions of the Environmental Protection and Biodiversity Conservation (EPBC) Act 1999 (as of September 2008), and the numbers of species subsequently included in the analysis.
Threats to species in Australia
We found that habitat loss is the greatest threat affecting extant threatened species in Australia (81.0% of species; figure 1). Introduced species were found to threaten a large proportion of Australia's threatened species (61.0%), as were inappropriate fire regimes (43.5%). Overexploitation (19.8%), disease (15.3%), natural causes (14.9%), native species interactions (14.9%), and pollution (13.6%) were all found to affect much smaller proportions of all threatened species. The importance of the major threatening processes varies significantly among habitats (p < 0.0001, χ2 = 247.9, degrees of freedom [df] = 14; table 3). Although habitat loss is the most commonly reported threat for terrestrial (81.2%) and freshwater species (80.5%), overexploitation affects the greatest proportion of marine threatened species (80.0%). Inappropriate fire regimes are a major threat for terrestrial species (47.3%), but rarely for freshwater species (19.5%). Marine and freshwater species are more severely affected by pollution (63.3% and 36.6%, respectively) than are terrestrial species (9.3%). Some key differences in the impact of threats among taxonomic groups were also apparent. Amphibians were found to be more affected by introduced species than were other taxa (86.4%), and disease (72.7%) is equally as prevalent as habitat loss for this group. Birds sustain greater impact from disease (29.8%) compared with all other species and are the taxon most affected by overexploitation (49.0%).
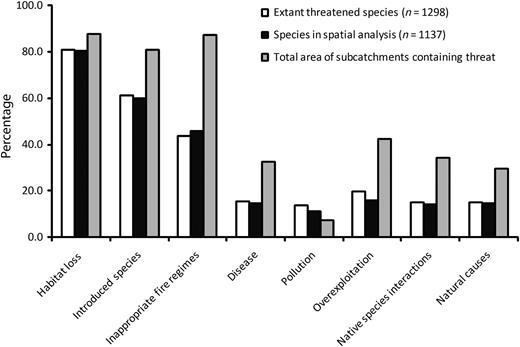
The relative impacts of major threatening processes expressed as the percentage of extant species threatened, the percentage of mapped species threatened (the subset of extant threatened species for which spatial data were available), and the percentage of continental area of Australia across which the threat occurs within subcatchments.
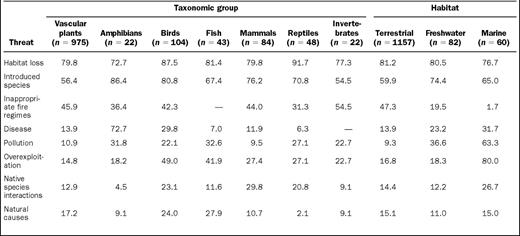
Summary of the prevalence of eight major threats to Australia's threatened species, expressed as the percentage of species affected by taxonomic group and habitat.
More than 75% of species assessed are reported to be affected by multiple threatening processes; on average, each species faces 2.6 threats (±1.4 standard deviation [SD]). This result differs significantly according to kingdom, with plant species facing a greater number of threats than animals (mean 3.0 and 2.5 threats, respectively; t = 6.18, df = 550.14, p < 0.0001). Terrestrial and freshwater species are on average affected by similar numbers of threats (2.8 and 2.6, respectively); however, marine species face significantly more threats than species in the other two habitats (3.6 Tukey HSD, p < 0.001).
The spatial distribution of threat
We determined the spatial distribution of threats using the models of terrestrial and freshwater species distributions as surrogates for the presence of the threats that affect them. Species distribution models from the Species of National Environmental Significance spatial database (DEWHA 2008b) were used to map the spatial distributions of threatening processes across the Australian continent. A wide range of methods were used to produce the species distribution maps, but generally these maps represent area of occupancy rather than extent of occurrence (sensuGaston and Fuller 2009). We considered only polygons that were identified as having known or likely species occurrences and removed from the analysis polygons where species “may occur.” For this analysis, we excluded marine species as our focus for the spatial analysis of threats was continental Australia. We also excluded any terrestrial or freshwater EPBC Act—listed species with no available spatial data table 2), leaving a total of 1137 species for analysis. The proportion of species threatened by inappropriate fire regimes was slightly higher (46.0%; figure 1), and a lower proportion was affected by pollution (11.0%) and overexploitation (16.0%) within the group of mapped species. The absence of marine species in this group is likely to have driven this trend. Nevertheless, the observed differences in the proportions of species threatened among all extant threatened species and the mapped species were not significant (p = 0.29, χ2 = 8.40, df 57).
We matched the listed threats for each species to their corresponding distribution model and then mapped the spatial data corresponding to each threat within a geographic information system (ArcGIS 9.2, ESRI).To determine the spatial distributions of threats, we calculated the proportion of species affected by each of the eight major threats in each of 62,629 subcatchments (Stein 2007) across the Australian continent (figure 2a–2h) with respect to the overall threatened species richness contained within each subcatchment (figure 2i). Subcatchments have previously been used as planning units in conservation planning exercises conducted at the continental scale (Klein et al. 2009a, 2009b, Fuller et al. 2010).
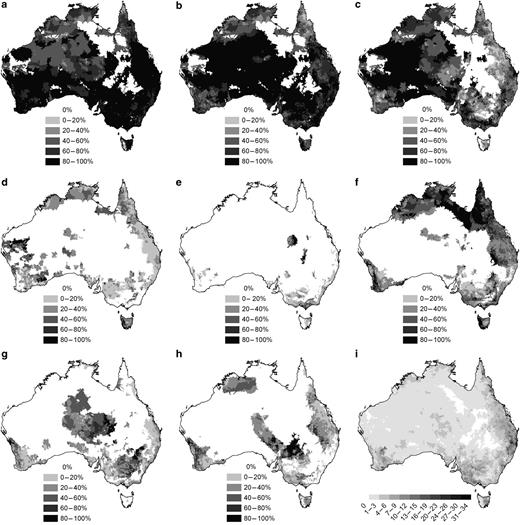
The percentage of threatened freshwater and terrestrial species in each subcatchment affected by (a) habitat loss, (b) introduced species, (c) inappropriate fire regimes, (d) disease, (e) pollution, (f) overexploitation, (g) native species interactions, and (h) natural causes. To aid in interpretation of proportions, the distribution of threatened species richness is shown in (i).
The three principal threats affecting species at a national scale (habitat loss, inappropriate fire regimes, and introduced species) were found to be extremely spatially pervasive (figure 2). In particular, the threat of inappropriate fire regimes is almost ubiquitous across the continent, affecting a high proportion of species (≥ 80%) within the majority of subcatchments (figure 2c). The other five threatening processes are much more patchily distributed. Disease and overexploitation appear to be particularly important in northern and eastern Australia (figure 2d, 2f), and have an almost inverse relationship with native species interactions and natural causes (figure 2g, 2h); this might be expected, as both are prevalent in the relatively intact interior of the continent.
Threats to species distributed across a large spatial extent in Australia were not always reported to affect a similarly high proportion of species. For example, inappropriate fire regimes threaten species persistence within subcatchments across 87.1% of Australia's landmass (figure 2c), yet affect only 46.0% of threatened species (figure 1). Habitat loss affects a proportion of species across a geographical area of similar magnitude, suggesting an almost direct connection between the area affected and species imperilment. Pollution was the only threat found to affect a greater proportion of species than geographic areas, which makes intuitive sense given the point sources of many pollution events. These results imply that there are differences in the nature of endangerment or intensity of particular threats, in addition to the relative vulnerability of species to varying threats or biological factors (Isaac and Cowlishaw 2004). For instance, the patchiness and limited spatial extent of threats such as disease and pollution may be because those threats represent inherently more spatially constrained processes than pervasive threats such as habitat loss or fire. Alternatively, species affected by certain threats may have comparatively small range sizes, or may be sparsely distributed either naturally or as a consequence of the threat itself. Either way, our results suggest that analyses based on proportions of species affected by particular threats can underestimate the size of the conservation problem in spatial terms. This is an important finding, as the costs of conservation management actions are usually strongly influenced by the amount of area required for treatment; therefore, determining the spatial extent of threatening processes is crucial to estimating the costs of dealing with them (Wilson et al. 2007).
We identified the threat affecting the greatest proportion of species within each subcatchment, hereafter termed the predominant threat (figure 3). Habitat loss was found to predominate in subcatchments across much of southwestern, eastern, and southeastern Australia, all areas where extensive habitat clearance for agriculture has occurred (Beeton et al. 2006). However, there are large areas of the continent where a greater proportion of species are affected by threats other than habitat loss. Inappropriate fire regimes appear to predominate in subcatchments in northern Australia, a part of the continent that typically has the highest frequency of wildfires (Russell-Smith et al. 2007, Woinarski et al. 2007). However, our analysis shows there is no clear predominant threat in much of this region because habitat loss, introduced species, and inappropriate fire regimes show a similar degree of prevalence at the subcatchment scale (figures 2a–2c). Introduced species appear to be a key threat within subcatchments of central Australia, a region where feral populations of predators and herbivores are widely distributed (West 2008, Saalfeld and Edwards 2010). There is much spatial heterogeneity in the predominance of threats in southeastern Australia, which is also a region where many different threats operate simultaneously.
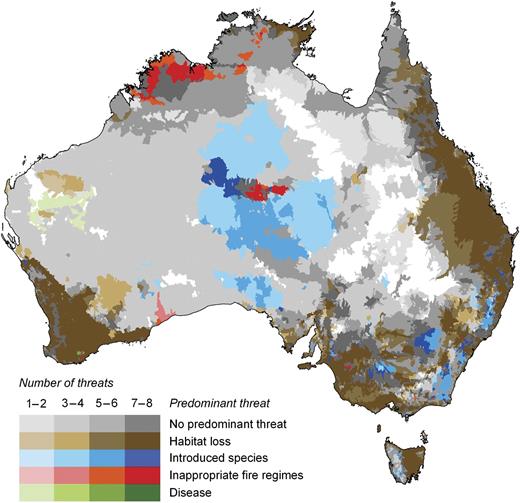
The distribution of the predominant threats to biodiversity across Australia. The “predominant threat” is the threat affecting the greatest number of species in each subcatchment. Where two or more threats affect an equivalent number of species, we consider there to be no predominant threat occurring in these subcatchments, displayed here in shades of gray. Darker colors indicate a larger overall number of threats occurring in the subcatchment. White indicates areas where no threatened species occur.
A mean of 5.7 threats (±1.8 SD) occurs within each subcatchment, and 14.1% of subcatchments contain species that combined are affected by all eight major threatening processes. Importantly, our results confirm that multiple threats may be present even in areas considered to be wilderness, such as in northern and central Australia, which have historically experienced minimal habitat loss and contain a comparatively low richness of threatened species (figure 2i) and human population density (Woinarski et al. 2007, Watson et al. 2009).
Using threat mapping to guide conservation
In concurrence with previous studies at global (Baillie et al. 2004, Vié et al. 2009) and national scales (Wilcove et al. 1998, Venter et al. 2006), we found that habitat loss is the primary driver of imperilment for threatened species in Australia. Extensive livestock grazing, broadscale land clearing, and urbanization (James et al. 1999, Yencken and Wilkinson 2000, Beeton et al. 2006), are widely recognized as having major and widespread impacts upon native biodiversity in Australia, with the situation expected to worsen with projected future increases in human population and consumption (Kingsford et al. 2009). Our analysis shows that introduced species and inappropriate fire regimes are much more widespread threats to species in Australia than in other countries. Venter and colleagues (2006) found only a small proportion of Canada's threatened species to be affected by introduced species, and concluded that this threat may not be a major cause of endangerment on continents. Our findings suggest otherwise for Australia, since almost two-thirds of Australia's threatened species are affected by introduced plants or animals. Despite Australia's large size, its geographic isolation may have predisposed the largely endemic biota to a high level of threat from invasive species (Salo et al. 2007). The extinctions of numerous endemic marsupials have largely been attributed to invasive vertebrates such as the red fox (Vulpes vulpes) and feral cat (Felis catus;Short and Smith 1994). Fire affects less than 1% of threatened vertebrates in China (Li and Wilcove 2005), whereas in the United States it affects 14% of threatened species (Wilcove et al. 1998). In Australia, however, inappropriate fire regimes are the third-most frequently identified threat (46% of threatened species), and as inferred from the distributions of affected species, occur across a disproportionately wide spatial extent (figure 1). Australia is one of the most fire-active countries in the world (Russell-Smith et al. 2007), and the disruption of natural fire processes has affected habitat structure, food availability, and species dynamics (Keith et al. 2002). In comparison with other assessments of threats to species in Australia, our findings confirm that habitat loss is the major cause of threat for vascular plants (Burgman et al. 2007), but we found a higher proportion of species reported to be threatened by habitat loss, introduced species, and overexploitation than did Kingsford and colleagues (2009). Differences in the relative proportions of species within broad taxonomic groups or preferred habitat could explain some of the differences between our results and those of Kingsford and colleagues (2009), and our analysis also considered more than three times as many species.
Our results indicate that broad compilations of the proportions of species affected by particular threats do not adequately capture the inherent variation in the spatial distributions of the processes that threaten species persistence. Almost all major threats to species in Australia are distributed across a larger terrestrial area than expected from tabulations of species threatened at a national scale. In particular, threats not easily abated by the designation of protected areas without additional management, such as introduced species and inappropriate fire regimes, affect species across the majority of the Australian continent. This is important for conservation policy and management, since the resources required to mitigate specific threatening processes on the ground may be much higher than expected if the spatial distribution of threats is not explicitly considered when allocating funding. Although habitat loss is the major threat for species at a national scale and across much of the continent, it is clear this threat does not operate in isolation. The vast majority of the threatened species we assessed are reported to be affected by multiple threats, as are almost all subcatchments across the Australian continent where threatened species occur. As such, conservation management that mitigates multiple, pervasive threats will often be required, even in remote locations.
There are some caveats to our approach that need to be addressed. In summarizing the major threats to species in Australia, we were not able to consider the relative certainty or impact of specific threats to species, and by extension could not incorporate this information into our analysis of the spatial distributions of these threats. We have also assumed that the summed geographical distribution of species affected by a particular threat reflects the actual spatial extent of that threat across the continent. We expect there to be a degree of error associated with reporting the prevalence and spatial extent of threats with any spatial unit of analysis. Given the broad geographical area covered, we believe subcatchments represent the most relevant spatial unit for the research we have presented here. Having been used previously for spatial conservation prioritization analyses that have captured wilderness quality (Klein et al. 2009a), ecological and evolutionary processes (Klein et al. 2009b), and that have examined the performance of a protected system (Fuller et al. 2010), our results can be more directly compared with the findings of these studies and are more amenable for incorporation into any future analysis seeking to combine elements of all previous studies. For conservation planning over a smaller spatial scale, it would probably be more useful to consider the distribution of threats according to a finer-resolution grid, perhaps in addition to or alongside an analysis that considers the suite of threats found at the subcatchment level.
Although the models of species distributions and information on species threats represent the most comprehensive data available at a national scale in Australia, there will inevitably be a certain level of commission error in our analysis (i.e., assuming a threat to be present where it is not). In principle it is possible to map the distributions of specific threatening processes across each species' geographic range, although data limitations would make it very difficult to reach the broad taxonomic and geographic coverage we have achieved in this analysis. Our methodology can be applied at any spatial scale and in any location where adequate data on the distributions of species and causes of threat are available, although findings should be expected to be sensitive in areas containing a low richness of species. Considering these caveats, spatial maps of threats designed using only the distributions of species should ideally be combined with information on the distributions of threat as inferred from other sources, where such additional spatial data are available. Such a combination of data could reduce incidences of commission error and could also assist with identifying variation in the relative impact or intensity of particular threatening processes upon species within the spatial extent of that threat.
More generic approaches that assess spatial patterns in threats include human footprint mapping, which has been achieved at both global (Sanderson et al. 2002) and regional scales (Leu et al. 2008, Woolmer et al. 2008). By incorporating data on human population density, infrastructure, settlement, and access, the degree and spatial extent of anthropogenic influence is determined by summing the estimated impact of each driver upon species and ecosystems (Sanderson et al. 2002, Woolmer et al. 2008). One difficulty with this approach is in adequately representing threats in remote wilderness locations, although some recent analyses have incorporated indirect anthropogenic pressures (Leu et al. 2008). These methods may be further improved with spatial information detailing areas of ecological importance or critical habitats for threatened species (Woolmer et al. 2008).
Similar analyses in the marine realm have taken place at global (Halpern et al. 2008a) and regional scales (Halpern et al. 2009, Selkoe et al. 2009) through the mapping of cumulative impacts of a range threats to ecosystems. These differ from human footprint analysis because they explicitly link the distributions and impacts of specific threatening processes to the distributions of marine ecosystems with respect to the relative sensitivities of ecosystems to each threat, as well as their underlying condition (Halpern et al. 2008a). The sum of these individual impacts is then mapped to show the cumulative anthropogenic influence, allowing visualization of the total impact of threats, which are often compounded by synergies and interactions (Burgman et al. 2007, Brook et al. 2008, Halpern et al. 2008b). In addition to information detailing the cumulative impacts of threats, spatially explicit threat mapping ideally should delineate these impacts with respect to the specific drivers of threat, as well as the distributions of the species or ecosystems affected (Leu et al. 2008, Selkoe et al. 2009, Wilson et al. 2009) in order to inform conservation decisionmaking.
Conservation planning is increasingly taking a landscape or seascape approach, such that a broad range of actions can be identified to simultaneously address the impacts of a range of threatening processes both inside and outside formal protected areas (Wilson et al. 2007, 2009, Halpern et al. 2008b). Despite these advances, there are still calls for refinements to species distributional data in order to assist with conservation decisionmaking (Whittaker et al. 2005, Stuart et al. 2010). Species distributional data alone cannot inform the conservation decisionmaking process unless they are considered alongside a spatially explicit assessment of the processes that threaten biodiversity and the socioeconomic constraints associated with implementing specific conservation actions (Possingham and Wilson 2005). We therefore recommend that a far greater emphasis be placed on documenting and mapping the spatial distributions of specific threatening processes and considering how the cumulative impacts of threats to species vary across different locations and multiple spatial scales. Incorporating such a spatial context into future research will advance our understanding beyond simply knowing what specific processes threaten biodiversity, toward determining what mitigating actions we should take in a given location or at a certain spatial scale. In particular, disentangling past and present impacts of threatening processes, and predictions of future threats to biodiversity (Rouget et al. 2003, Burgman et al. 2007, Boakes et al. 2009, Watson et al. 2009), are high priorities for future research.
Acknowledgments
We are grateful to the following people for assistance in collating data for this manuscript: Naomi Nelson, Sharon Kazemi, Susan Kelly, Naomi Wynd, Jane Hosking, Jason Ferris, Angela McCauley, and Stuart Butt for the threats database, as well as Martin Taylor from World Wildlife Fund—Australia for providing habitat preferences for threatened species. We thank Lissa Barr, Yvonne Buckley, Craig Franklin, and Clive McAlpine for providing helpful feedback on an earlier version of this manuscript, and Kerrie Wilson for valuable discussion throughout the course of this project. We also thank three anonymous reviewers for feedback that greatly improved this manuscript. This research has been funded through the Australian government's Commonwealth Environment Research Facilities program.
References cited
Author notes
Megan C. Evans (m.evans1@uq.edu.au) is a research assistant, Oscar Venter is a doctoral student, and Hugh P. Possingham is a professor of ecology and mathematics, all based in the Ecology Centre at the University of Queensland, in Brisbane, Australia. James E. M. Watson is lead of the global climate adaptation team at the Wildlife Conservation Society, in Bronx, New York. Richard A. Fuller is a lecturer in biodiversity and conservation and holds a joint position at the University of Queensland's Ecology Centre and the Commonwealth Scientific and Industrial Research Organisation (CSIRO) Climate Adaptation Flagship and CSIRO Sustainable Ecosystems, in Brisbane, Australia. Simon C. Bennett and Peter R. Marsack are spatial ecologists with the Australian government's Department of Sustainability, Environment, Water, Population and Communities, in Canberra, Australia.
