By Matt Walker
For many years, telecommunications network operators (TNOs, or telcos) have faced slow revenue growth. Telco revenues grew 1-2% in 2017 and 2018, and declined 1.6% for the four quarters ended 3Q19. Because of this top-line limitation, telcos are continually examining their cost base and looking for efficiencies, particularly in the network. In the short-term, telcos face additional challenges from the spread of COVID-19 and its disruptions to economic activity. Telcos’ ongoing search for cost savings will heighten over the next six to 12 months, and this search will encompass energy costs.
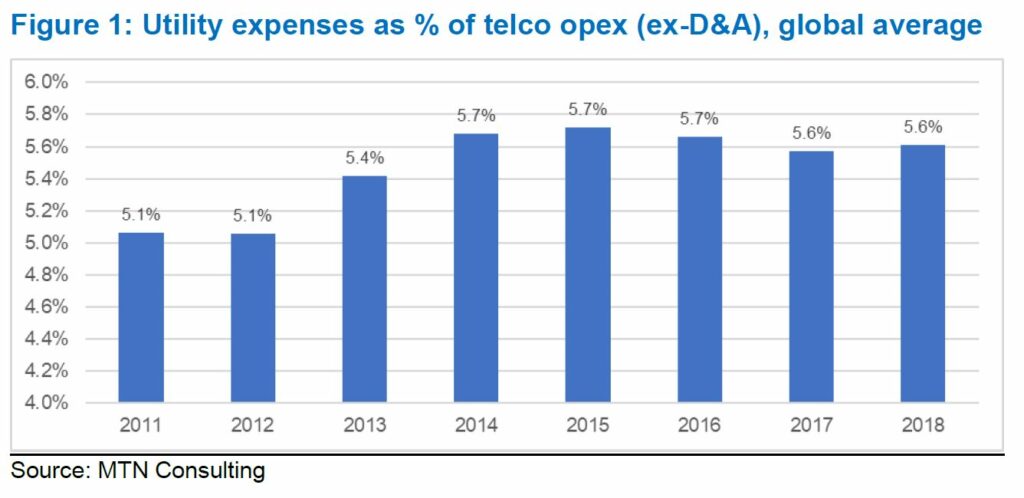
We estimate that telcos spend on average 5-6% of their operating expense (opex) — excluding depreciation and amortization (D&A) — on energy costs, usually reported as “utilities”. With the shift to 5G mobile access networks, there will be upwards pressure on this ratio. A typical 5G base station consumes up to twice or more the power of a 4G base station. The disparity can grow at higher frequencies, due to a need for more antennas and a denser layer of small cells. Edge compute facilities needed to support local processing and new Internet of things (IoT) services add to overall network power usage. The bottom line is that, in an increasingly 5G world, telcos will face significant growth in their energy bills. To address this issue, telcos will need to take actions at the organizational, architectural, and site levels.
- Table Of Contents
- Figure & Charts
- Coverage
- Visuals
Table Of Contents
- Summary
- Power costs are a big headache in mobile RAN and data centers, but there is hope
- Recommendations: Government, Vendors, Mobile Telcos
- About this report
- What’s the current situation?
- Telcos spent over $80 billion on energy costs in 2018, about 5.6% of opex
- Key findings
- How did we get here
- Limited top line growth opportunity puts pressure on costs
- What happens next?
- Predictions
- Appendix 1
Figure & Charts
Figures & Charts
- Figure 1: Utility expenses as % of telco opex (ex-D&A), global average
- Figure 2: ICT Electricity Consumption by Sector, 2015 (TWh)
- Figure 3: Electricity Consumption per Subscriber, 2010-15 (KWh/subscriber)
- Figure 4: Utility expenses as % of telco opex (ex-D&A), by company: 2016-2018 average
- Figure 5: Site power requirements, 2G, 2-4G, and 5G (per Huawei)
- Figure 6: Telco tactics for managing network power consumption
Coverage
Companies mentioned in this report include the following:
AT&T
China Mobile
China Telecom
China Unicom
CommScope
Crown Castle
Digital Realty
Ericsson
Huawei
Indosat
Microsoft Azure
National Instruments
Nokia
NTT
QTS Realty Trust
Schneider Electric
Telefonica
Telia
Visuals