
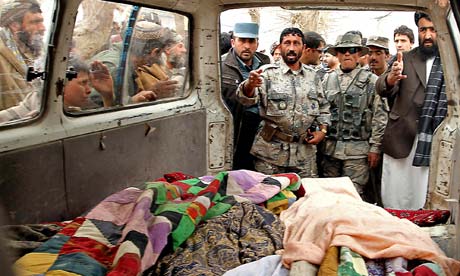
A NATO airstrike on Monday left 11 Afghan civilians (10 of whom were children) dead. But 2013 might mark an improvement in Afghanistan's conflict if the number of civilian casualties continues on its current trend.
2012, the latest year for which numbers are available, has shown the first drop since the United Nations Mission in Afghanistan (UNAMA) first began collecting on civilian casualties. Though the total number of casualties fell by 9%, the number of deaths fell by 12%, while the number of injured actually rose by 2%. Last year's figures bring the total number of civilians who have lost their lives in the armed conflict over the past six years to 14,728.
7,559 Afghan casualties were documented by UNAMA, of which 2,754 were deaths and 4,805 were injuries. The Taliban and other anti-government elements have been blamed for 4 out of every 5 civilians who were killed in Afghanistan last year - continuing a rising trend since 2007. The number of civilian deaths resulting from pro-government forces has by contrast fallen by 23%.
Improvised explosive devices (IEDs) killed the most Afghan civilians according to the UN, accounting for 41% of deaths in conflict. Between 1 January and 31 December 2012, UNAMA recorded 868 civilian deaths from IEDS. More noticeable however, is the number of targeted killings - 698 in 2012, up 62% from 2011 United Nations Assistance Mission in Afghanistan says:
Particularly disturbing were targeted killings of women by Anti-Government Elements demonstrated by the killings of the head and deputy head of the Laghman Department of Women's Affairs in August and December 2012 [...] Civilians continued to be targeted in places including crowded markets, locations where tribal elders gathered and civilian Government offices.
The report also suggests this might be part of a broader strategy from the Taliban:
[I]n a statement released in August 2012, the Taliban identified civilian Government employees as lawful targets. The deliberate targeting and killing of civilian members of the Government administration is a violation of international humanitarian law which stipulates that military objects only may be the lawful objects of attack.
While we are pretty good at providing detailed statistical breakdowns of coalition military casualties (and by we, I mean the media as a whole), we've not been so good at providing any kind of breakdown of Afghan civilian casualties. There has been some work done. Human Rights Watch has published breakdowns of civilian casualties, and academics such as Mark Herold at the University of New Hampshire have done detailed reporting on very specific periods of the operation.
Unama point out the difficulties with collecting the data:
A key reason for the difference between the 2011 and 2012 data is that civilian casualty statistics often change following the public release of such figures, as UNAMA only reports civilian casualty figures verified through multiple sources. This verification is a rigorous and time-consuming process, which is affected by the security situation. UNAMA also takes steps to verify new cases identified through its monitoring – regardless of when the incident occurred. Once new cases are verified, UNAMA adds the cases its database. The numbers often change on a daily basis as new information is added (eg. injured victims dying, confirmation of the civilian status of victims, as well as new incidents).
"Late" reporting is common and often occurs when UNAMA is verifying incidents in those areas which are extremely difficult to access or those incidents in which there is wide discrepancy between communities, government and security forces about what occurred. Sometimes, as has happened, it can take more than a year to fully verify. UNAMA publicly reports civilian casualty figures through its mid-year and annual Protection of Civilians reports, press statements as well quarterly reporting to the UN Secretary-General. These documents are available online.
You've noticed the gap in media reporting - asking us why we publish military deaths but not civilian casualties. The United Nations Mission in Afghanistan (UNAMA) publishes statistics on civilian casualties, splitting them into deaths caused by government/military forces, anti-government forces and so on. True, they're not very visible on the UNAMA site and are not updated regularly in a visible way - but they do seem to be the best we can get. They published a report in February this year which has provided these details.
Obviously, collecting accurate statistics in one of the most dangerous countries in the world is difficult. But the paucity of reliable data on this means that one of the key measures of the war has been missing from almost all reporting.
But several of the older statistics in this report are different to what they were cited as being a few years ago. For example, the 2013 report claims that there were 3,131 conflict-related civilians deaths in Afghanistan in 2011. The 2012 report however puts this number at 3,021. It is not clear whether these numbers have been updated, revised or simply misquoted. Where there is an inconsistency between the numbers, we've highlighted it and added a comment in the google spreadsheet attached.
We've summarised the numbers above using the latest report from UNAMA. Take a look and let us know what you think - and what you can do with it.
Data summary
Download the data
• DATA: download the full datasheet with details going back to 2006
More open data
Data journalism and data visualisations from the Guardian
World government data
• Search the world's government data with our gateway
Development and aid data
• Search the world's global development data with our gateway
Can you do something with this data?
• Flickr Please post your visualisations and mash-ups on our Flickr group
• Contact us at data@guardian.co.uk
• Get the A-Z of data
• More at the Datastore directory
• Follow us on Twitter
• Like us on Facebook
• More at the Datastore directory
• Follow us on Twitter